Integrate Web Profiler for Backend Gateway
Edit on GitHubThe Web Profiler for Backend Gateway provides detailed profiling information for requests made from Yves to Zed through the Backend Gateway. This enables developers to debug and analyze the performance of backend gateway calls directly from the Yves Web Profiler interface.
The Web Profiler for Backend Gateway is based on Symfony Profiler. For details, see Profiler documentation.
Prerequisites
Ensure that the following modules are installed with the specified versions:
spryker/web-profilerversion 1.6.5 or higherspryker/zed-requestversion 3.24.0 or higher
Installation
If the required modules are not yet installed or need to be updated, run:
composer require spryker/web-profiler:^1.6.5 --dev
composer require spryker/zed-request:^3.24.0
Integration
To use Web Profiler for Backend Gateway, you need to configure both Zed and Yves applications.
1. Backend Gateway Application configuration (Zed)
Add the Web Profiler Application Plugin to the Backend Gateway in Pyz\Zed\Application\ApplicationDependencyProvider:
src/Pyz/Zed/Application/ApplicationDependencyProvider.php
<?php

namespace Pyz\Zed\Application;

use Spryker\Zed\Application\ApplicationDependencyProvider as SprykerApplicationDependencyProvider;
use Spryker\Zed\WebProfiler\Communication\Plugin\Application\WebProfilerApplicationPlugin;

class ApplicationDependencyProvider extends SprykerApplicationDependencyProvider
{
    /**
     * @return array<\Spryker\Shared\ApplicationExtension\Dependency\Plugin\ApplicationPluginInterface>
     */
    protected function getBackendGatewayApplicationPlugins(): array
    {
        $plugins = [
            // Other plugins...
        ];

        if (class_exists(WebProfilerApplicationPlugin::class)) {
            $plugins[] = new WebProfilerApplicationPlugin();
        }

        return $plugins;
    }
}
2. Yves Web Profiler Widget configuration
Ensure that Web Profiler is enabled for Yves. For details on enabling Web Profiler Widget for Yves, see Integrate Web Profiler Widget for Yves.
Add the Zed Request Data Collector Plugin to Pyz\Yves\WebProfilerWidget\WebProfilerWidgetDependencyProvider:
src/Pyz/Yves/WebProfilerWidget/WebProfilerWidgetDependencyProvider.php
<?php

namespace Pyz\Yves\WebProfilerWidget;

use Spryker\Yves\WebProfilerWidget\WebProfilerWidgetDependencyProvider as SprykerWebProfilerDependencyProvider;
use Spryker\Yves\ZedRequest\Plugin\WebProfiler\WebProfilerZedRequestDataCollectorPlugin;

class WebProfilerWidgetDependencyProvider extends SprykerWebProfilerDependencyProvider
{
    /**
     * @return array<\Spryker\Shared\WebProfilerExtension\Dependency\Plugin\WebProfilerDataCollectorPluginInterface>
     */
    protected function getDataCollectorPlugins(): array
    {
        return [
            new WebProfilerZedRequestDataCollectorPlugin(),
        ];
    }
}
Accessing Backend Gateway profiles
When a Yves page makes requests to the Backend Gateway, the Web Profiler automatically captures detailed profiles for each request.
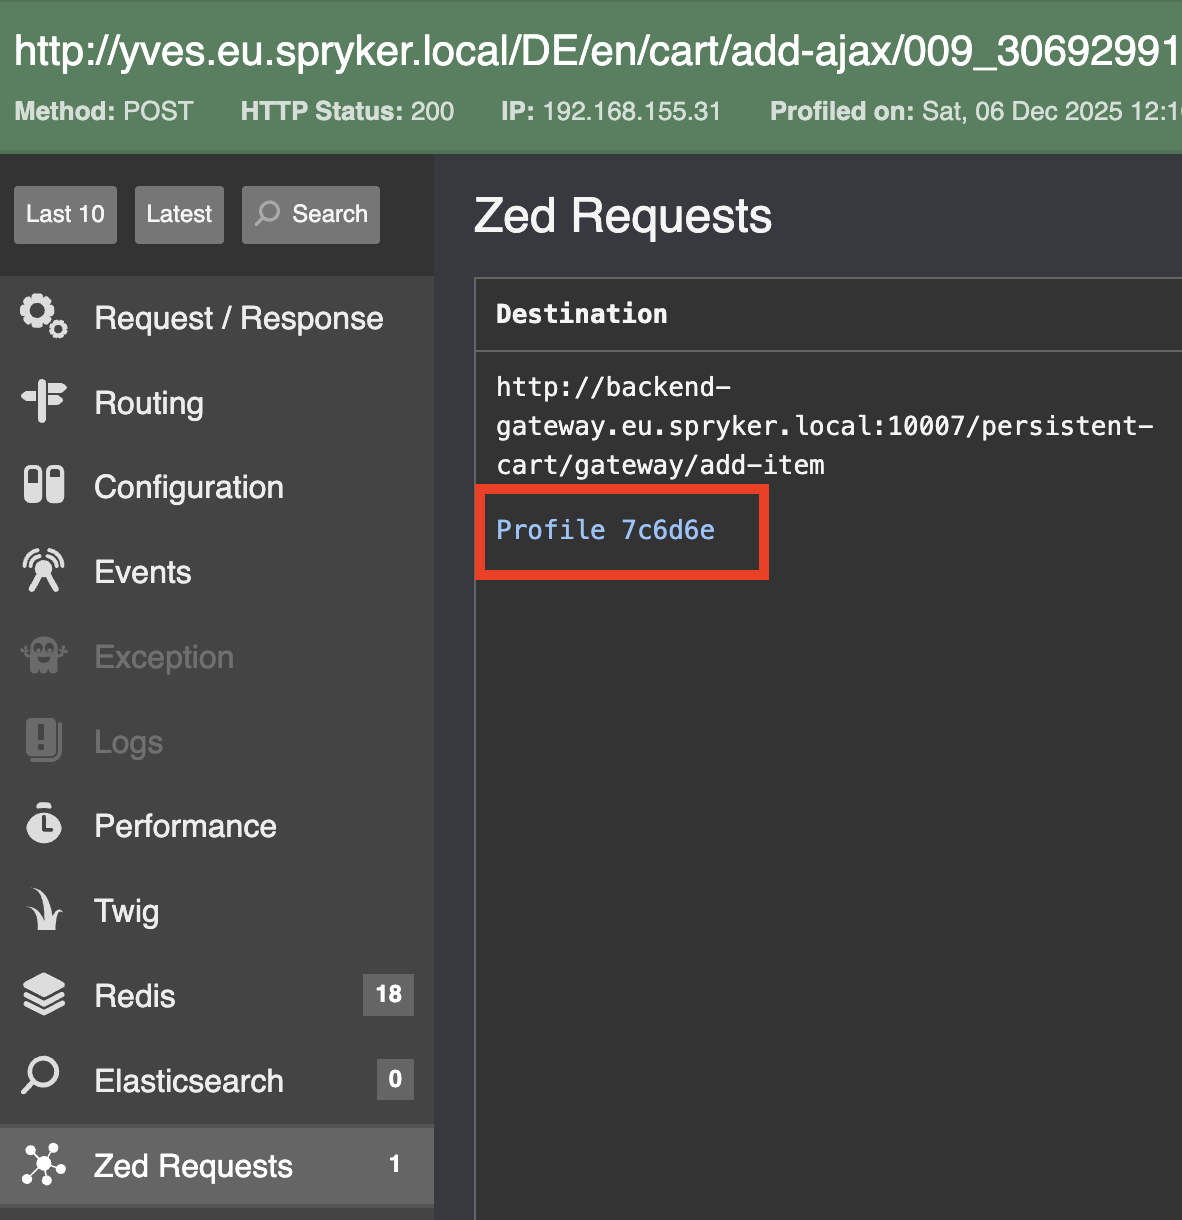
Viewing gateway request links
In the Yves Web Profiler toolbar, navigate to the Zed Requests section. Each Backend Gateway request displays a profile link that allows you to access the detailed execution profile for that specific request.
Viewing gateway profile details
Clicking on the profile link opens the comprehensive Web Profiler view for the Backend Gateway request, showing:
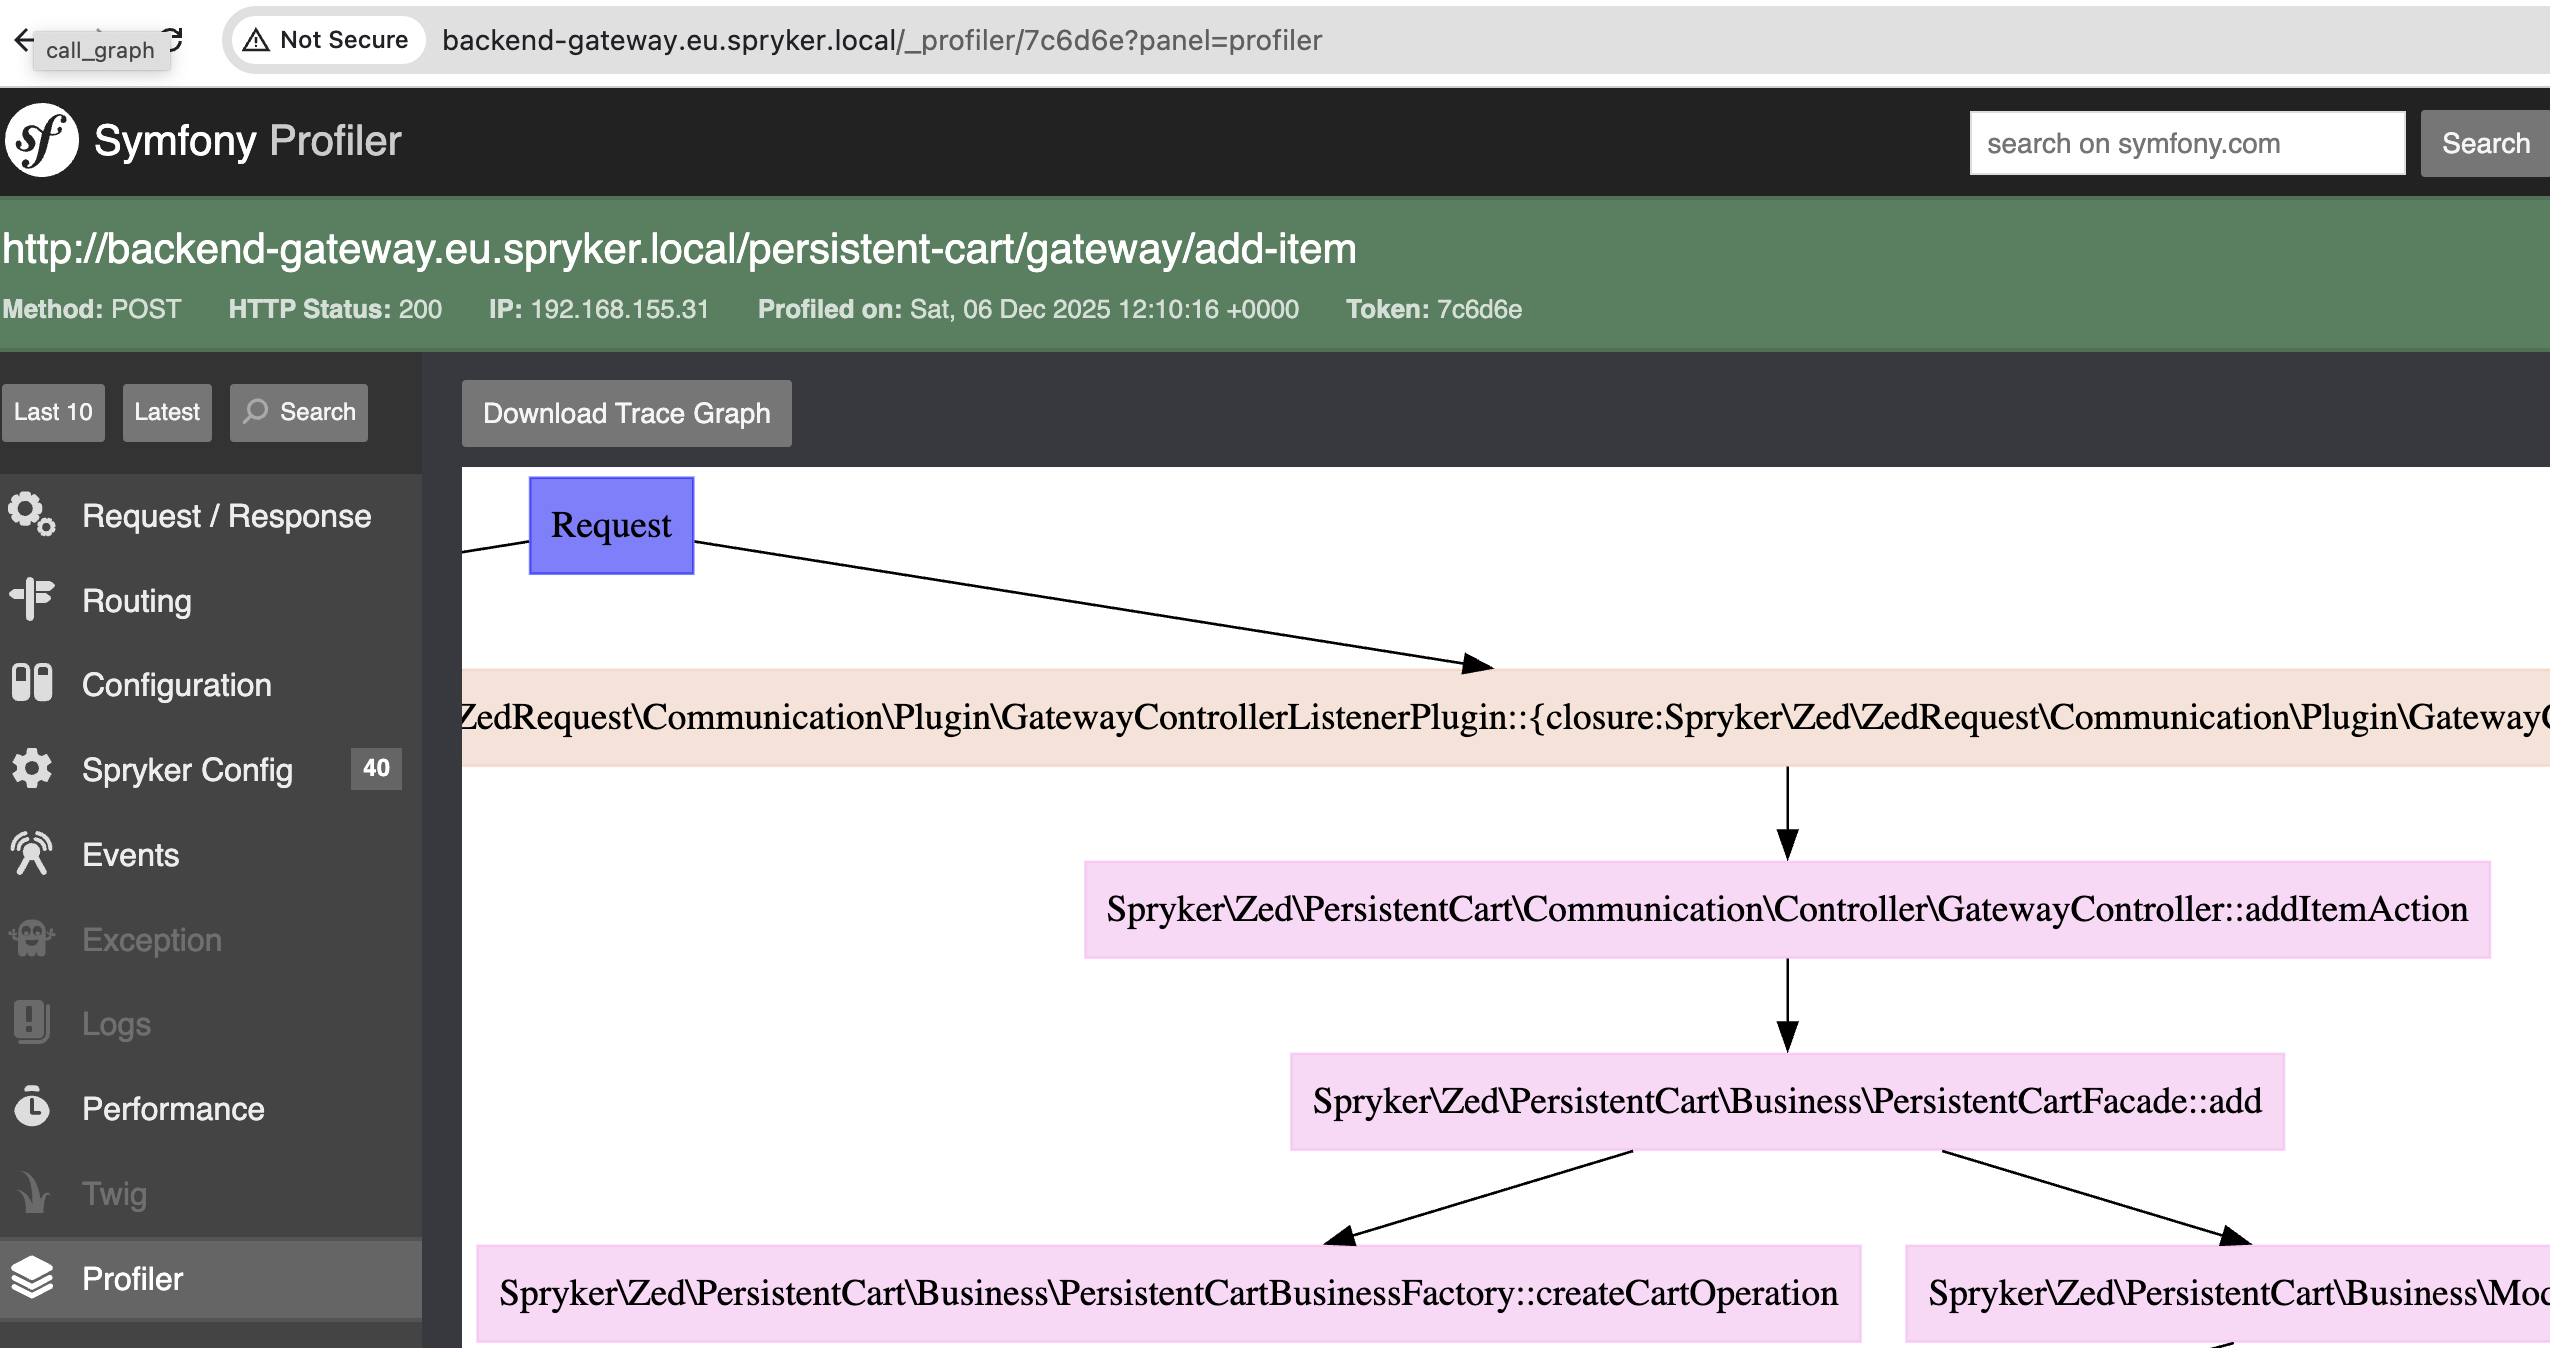
Additional profiling with XHProf
If the xhprof extension is enabled and the Profiler module is integrated, Backend Gateway profiles also include detailed performance profiling data through XHProf. This provides function-level performance analysis and call graphs.
For information on integrating the Profiler module, see Integrate Profiler Module.
Thank you!
For submitting the form