Publish and synchronize: Debugging
Edit on GitHubThis guide helps you debug issues related to the Publish & Synchronize (P&S) mechanism. Typical issues:
-
A product (or another entity) is saved, but the data on the product details page is not updated.
-
A product (or another entity) is saved, but changes are not reflected in the search results.
The following guidelines use the spy_product_abstract entity as an example.
Make the changes described in this document only in your local development environment.
1. Trigger entity publish
P&S is triggered by propel behavior on a save event, or manually via commands.
Back Office: If you update an entity in the Back Office–for example, saving changes on the product page–this action automatically triggers the publish process.
2. Check logs
Log output helps identify errors during publishing. We recommend checking logs using the dashboard.
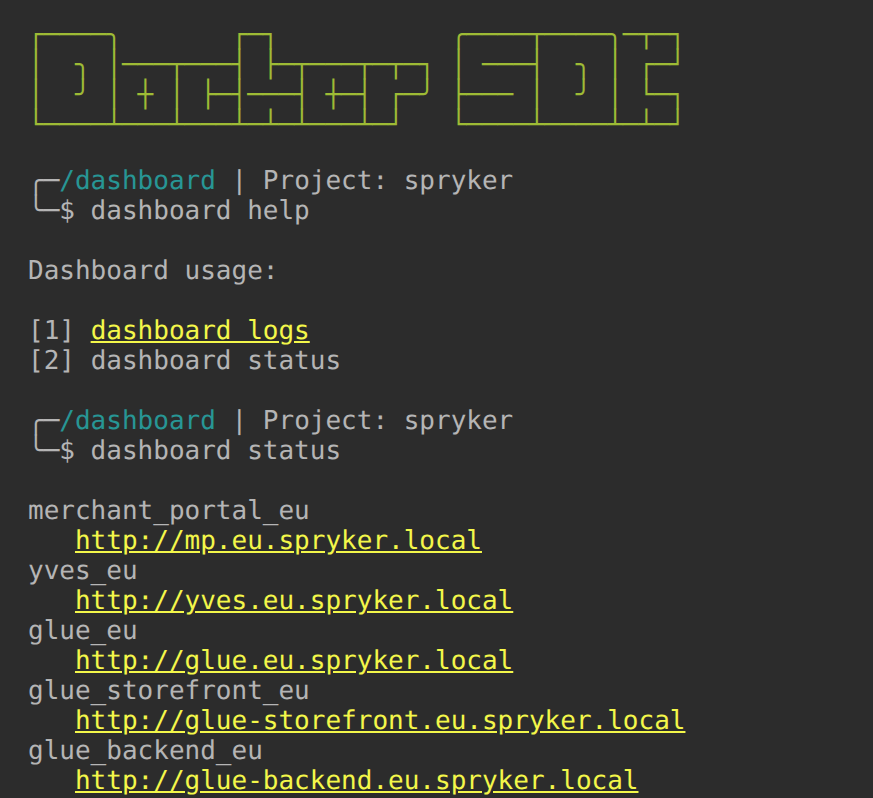
You can find the dashboard address: in deploy.dev.yml:
dashboard:
    engine: dashboard
    endpoints:
        spryker.local:
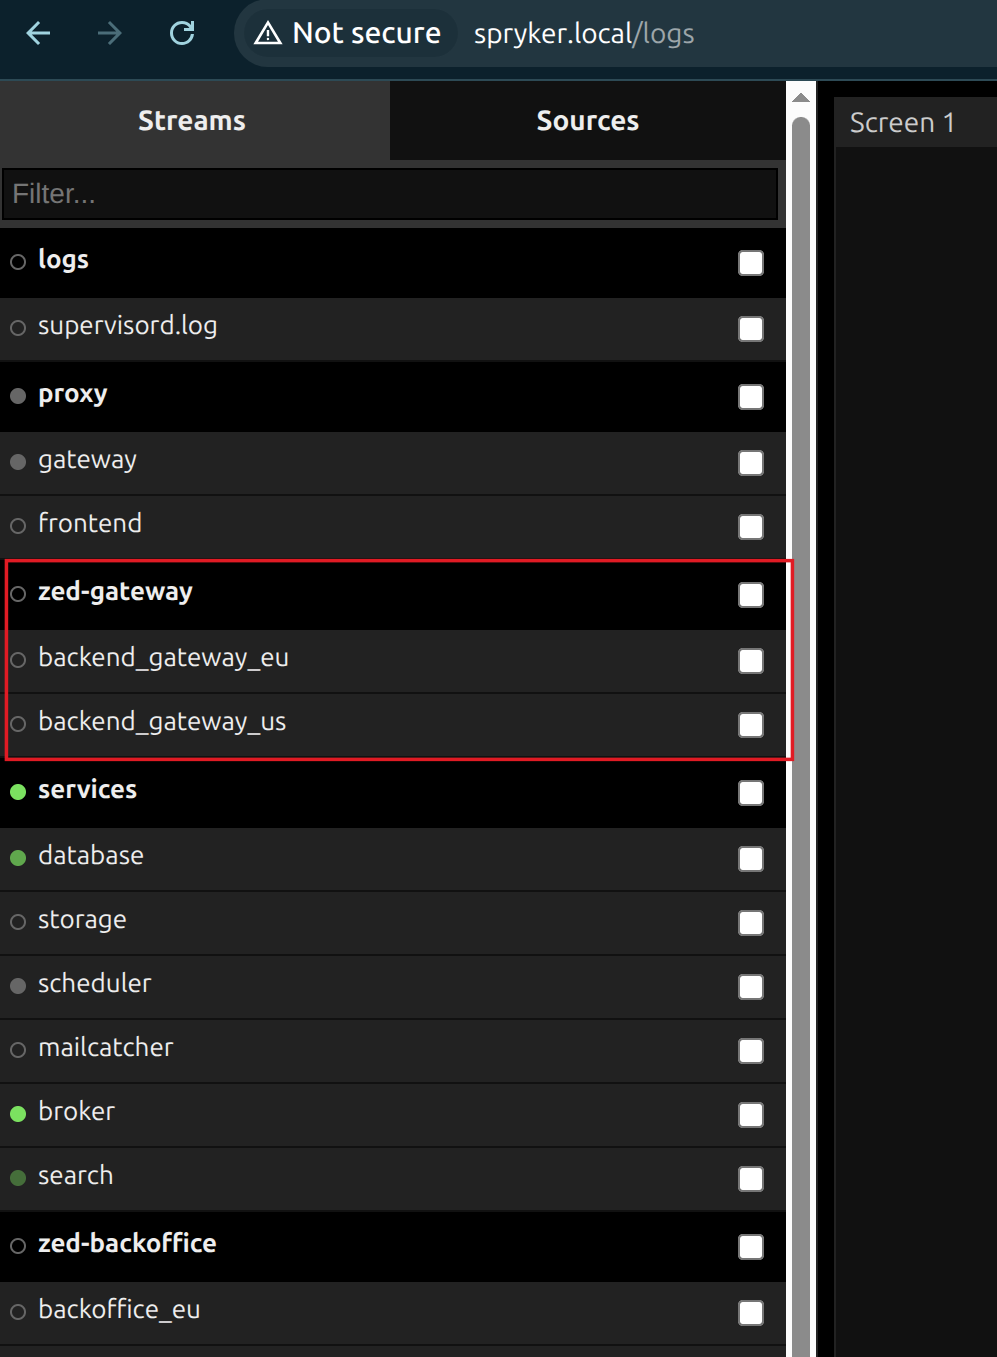
In the dashboard logs, there’s a large number of log groups. To avoid an overwhelming stream of log entries, select only the group or groups you’re interested in. For example, if you want to view all gateway logs, select the zed-gateway group. If you need logs for a specific store, such as the EU backend, choose backend_gateway_eu.
3. Check queues
After publishing, Spryker places messages in queues for further processing into storage or search systems. This section explains how to check for unprocessed and failed tasks.
Find RabbitMQ access details
In deploy.dev.yml, find the broker configuration:
    broker:
        engine: rabbitmq
        version: '4.1'
        api:
            username: 'spryker'
            password: 'secret'
        endpoints:
            queue.spryker.local:
            localhost:5672:
                protocol: tcp
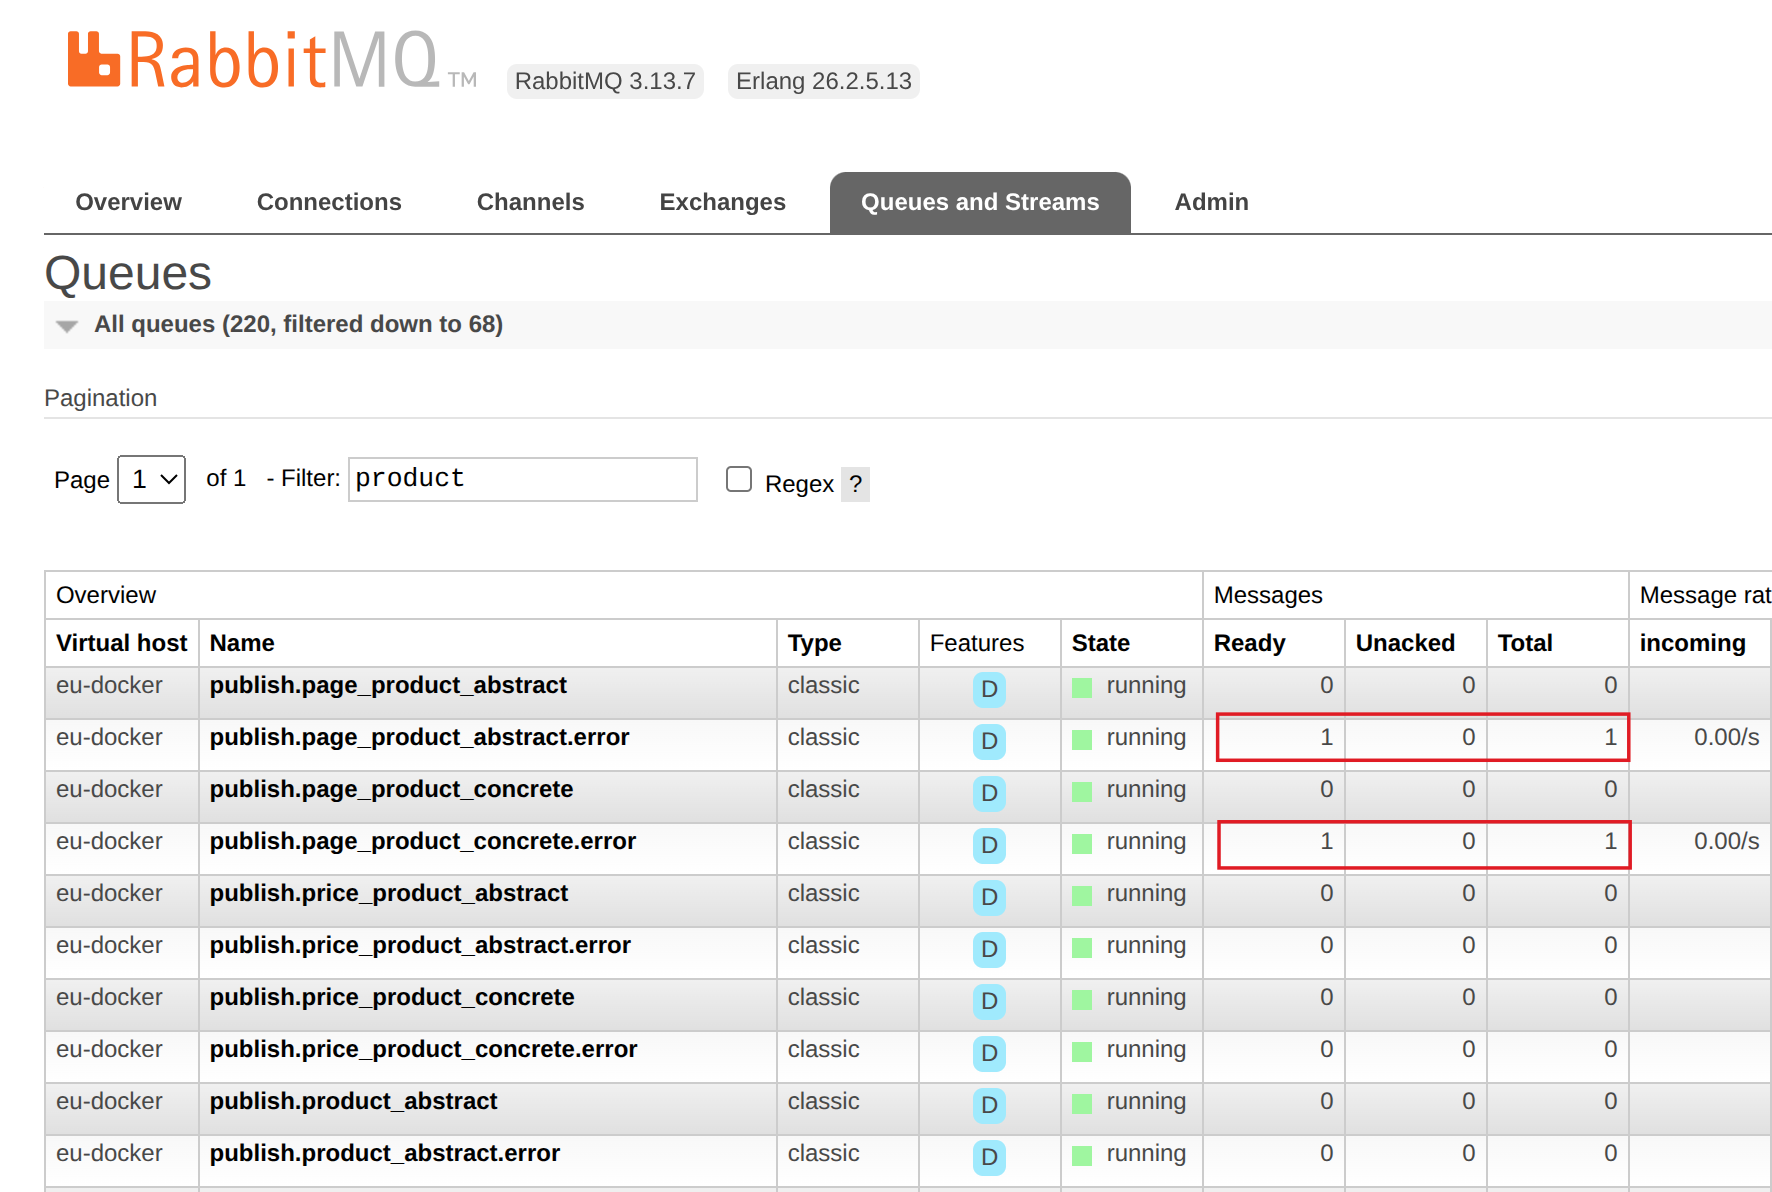
In this example, open queue.spryker.local in your browser to inspect queues.
How to find a failed queue
In RabbitMQ, you can search for queues by the entity name. In the filtered results, look for queue names that end with .error. These indicate failed queues.
Debugging queue processing
Queue jobs are automatically processed by Jenkins commands.
To debug queues manually, you must disable Jenkins automation. You can do this by disabling specific Jenkins jobs or temporarily suspending Jenkins.
-
For more information on Jenkins, see Jenkins operational best practices
-
For setting up a debugging environment, see Configure debugging
-
For configuring debugging in your project, see Configure debugging
-
For more details on queue failed tasks, see Messages are moved to error queues
4. Check storage and search tables
The problem might be in the data not reaching storage (Redis) or search (Elasticsearch).
Check storage (Redis)
-
Check the
spy_product_abstract_storagetable. If the table doesn’t contain the correct data or the data for the entity is missing, the issue is likely in the data collection or denormalization during the publishing process. Check the{Entity}PublishListenerand review the logs. -
If the table contains the correct data, inspect the Redis entries using Redis Commander. If the Redis data does not match the storage entity, the issue is likely in the synchronization step of the publishing process. Check the queue and relevant logs.
-
If the data in Redis is correct, but the frontend still displays incorrect data, the issue is likely related to data reading or post-processing after Redis retrieval. Review the frontend implementation for the specific entity.
You can find Redis Commander endpoint in deploy.dev.yml:
    redis-gui:
        engine: redis-commander
        endpoints:
            redis-commander.spryker.local:
In this example, open redis-commander.spryker.local in your browser.
Check search (Elasticsearch)
Check tables like spy_product_abstract_search. If the table doesn’t contain the correct data or the data for the entity is missing, the issue is likely in the data collection or denormalization during the publishing process.
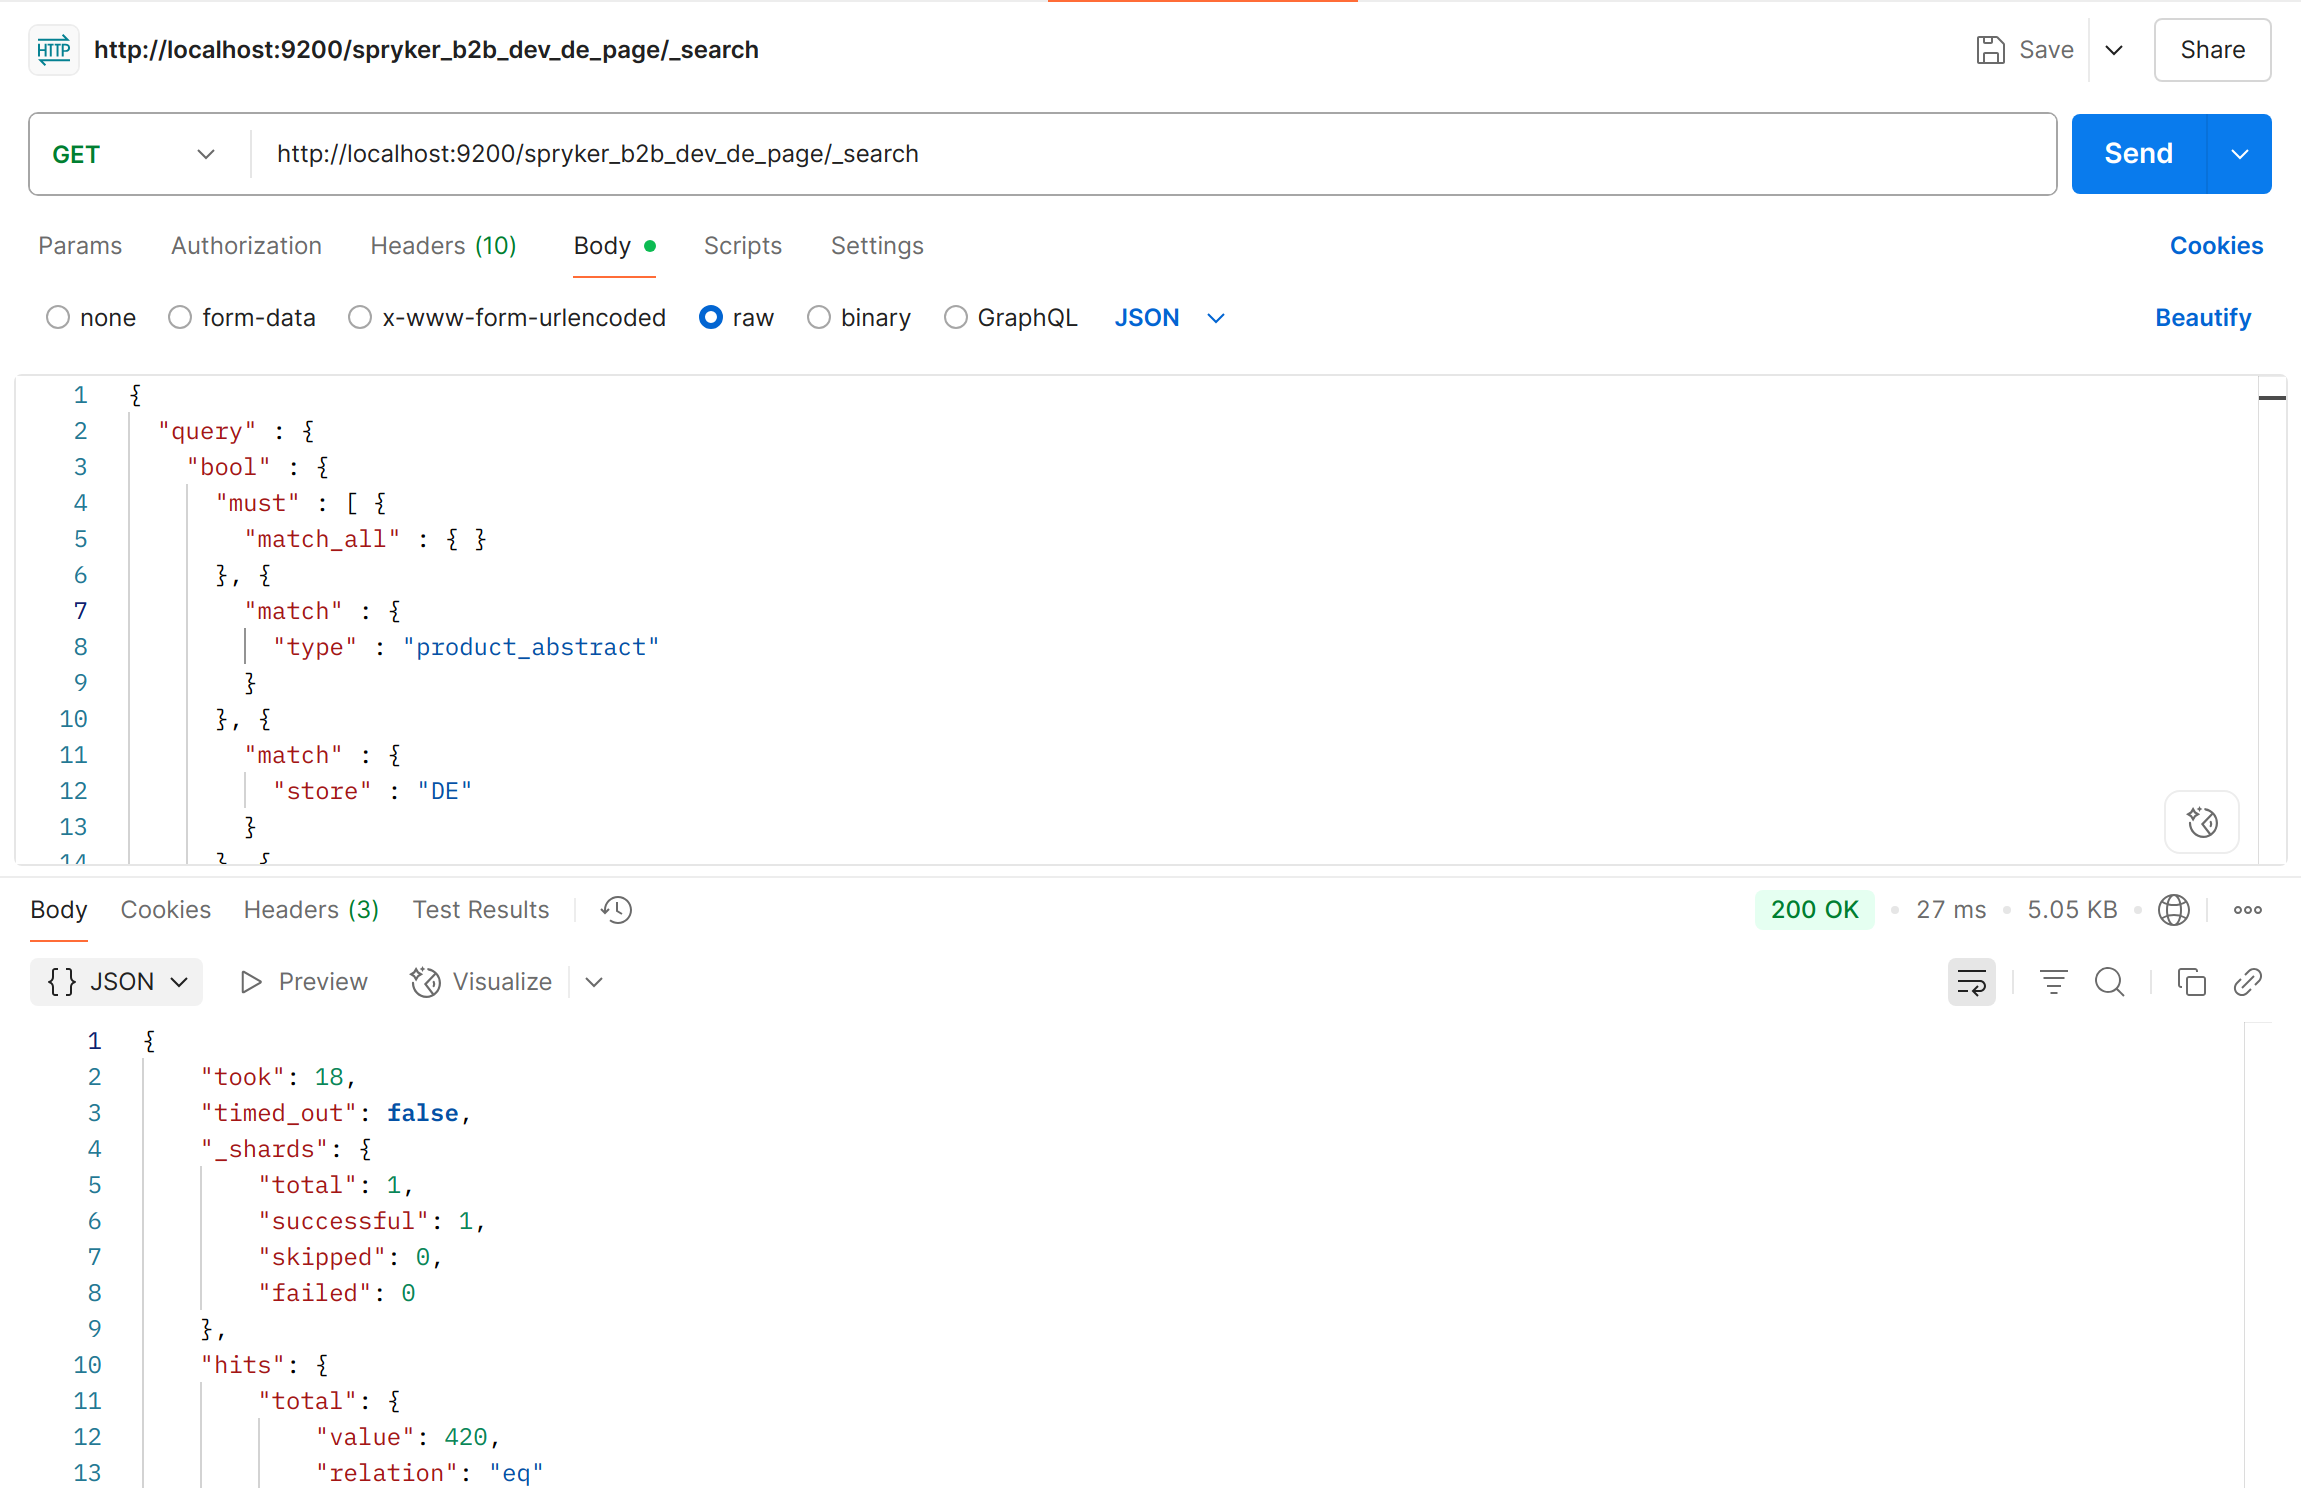
You can also send a direct request to the Elasticsearch endpoint and verify the response.
Make a direct Elasticsearch request
- Open the page that triggers the search request–for example, the catalog page. It may trigger multiple Elasticsearch queries.
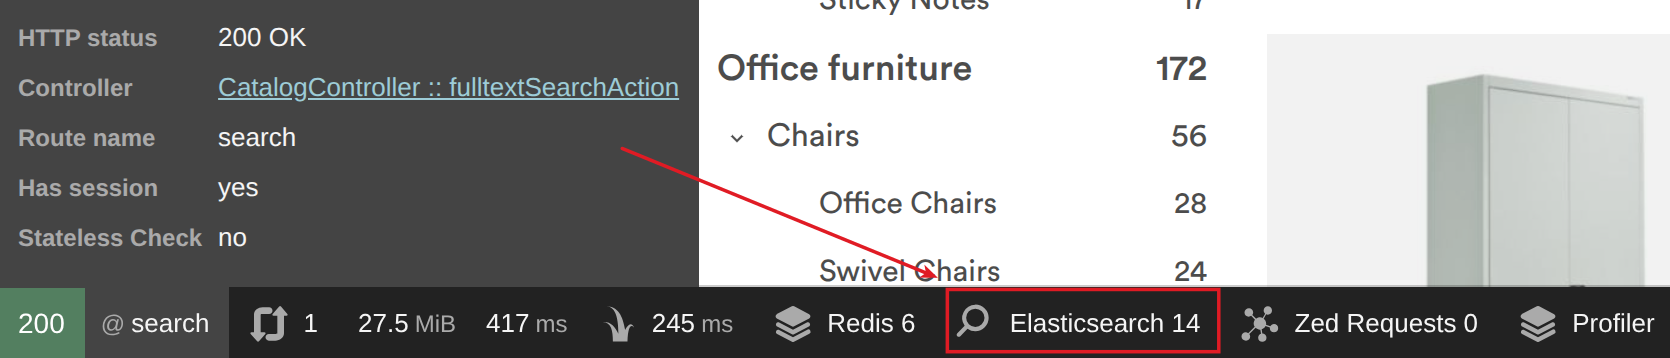
- Open the profiler data for the request:
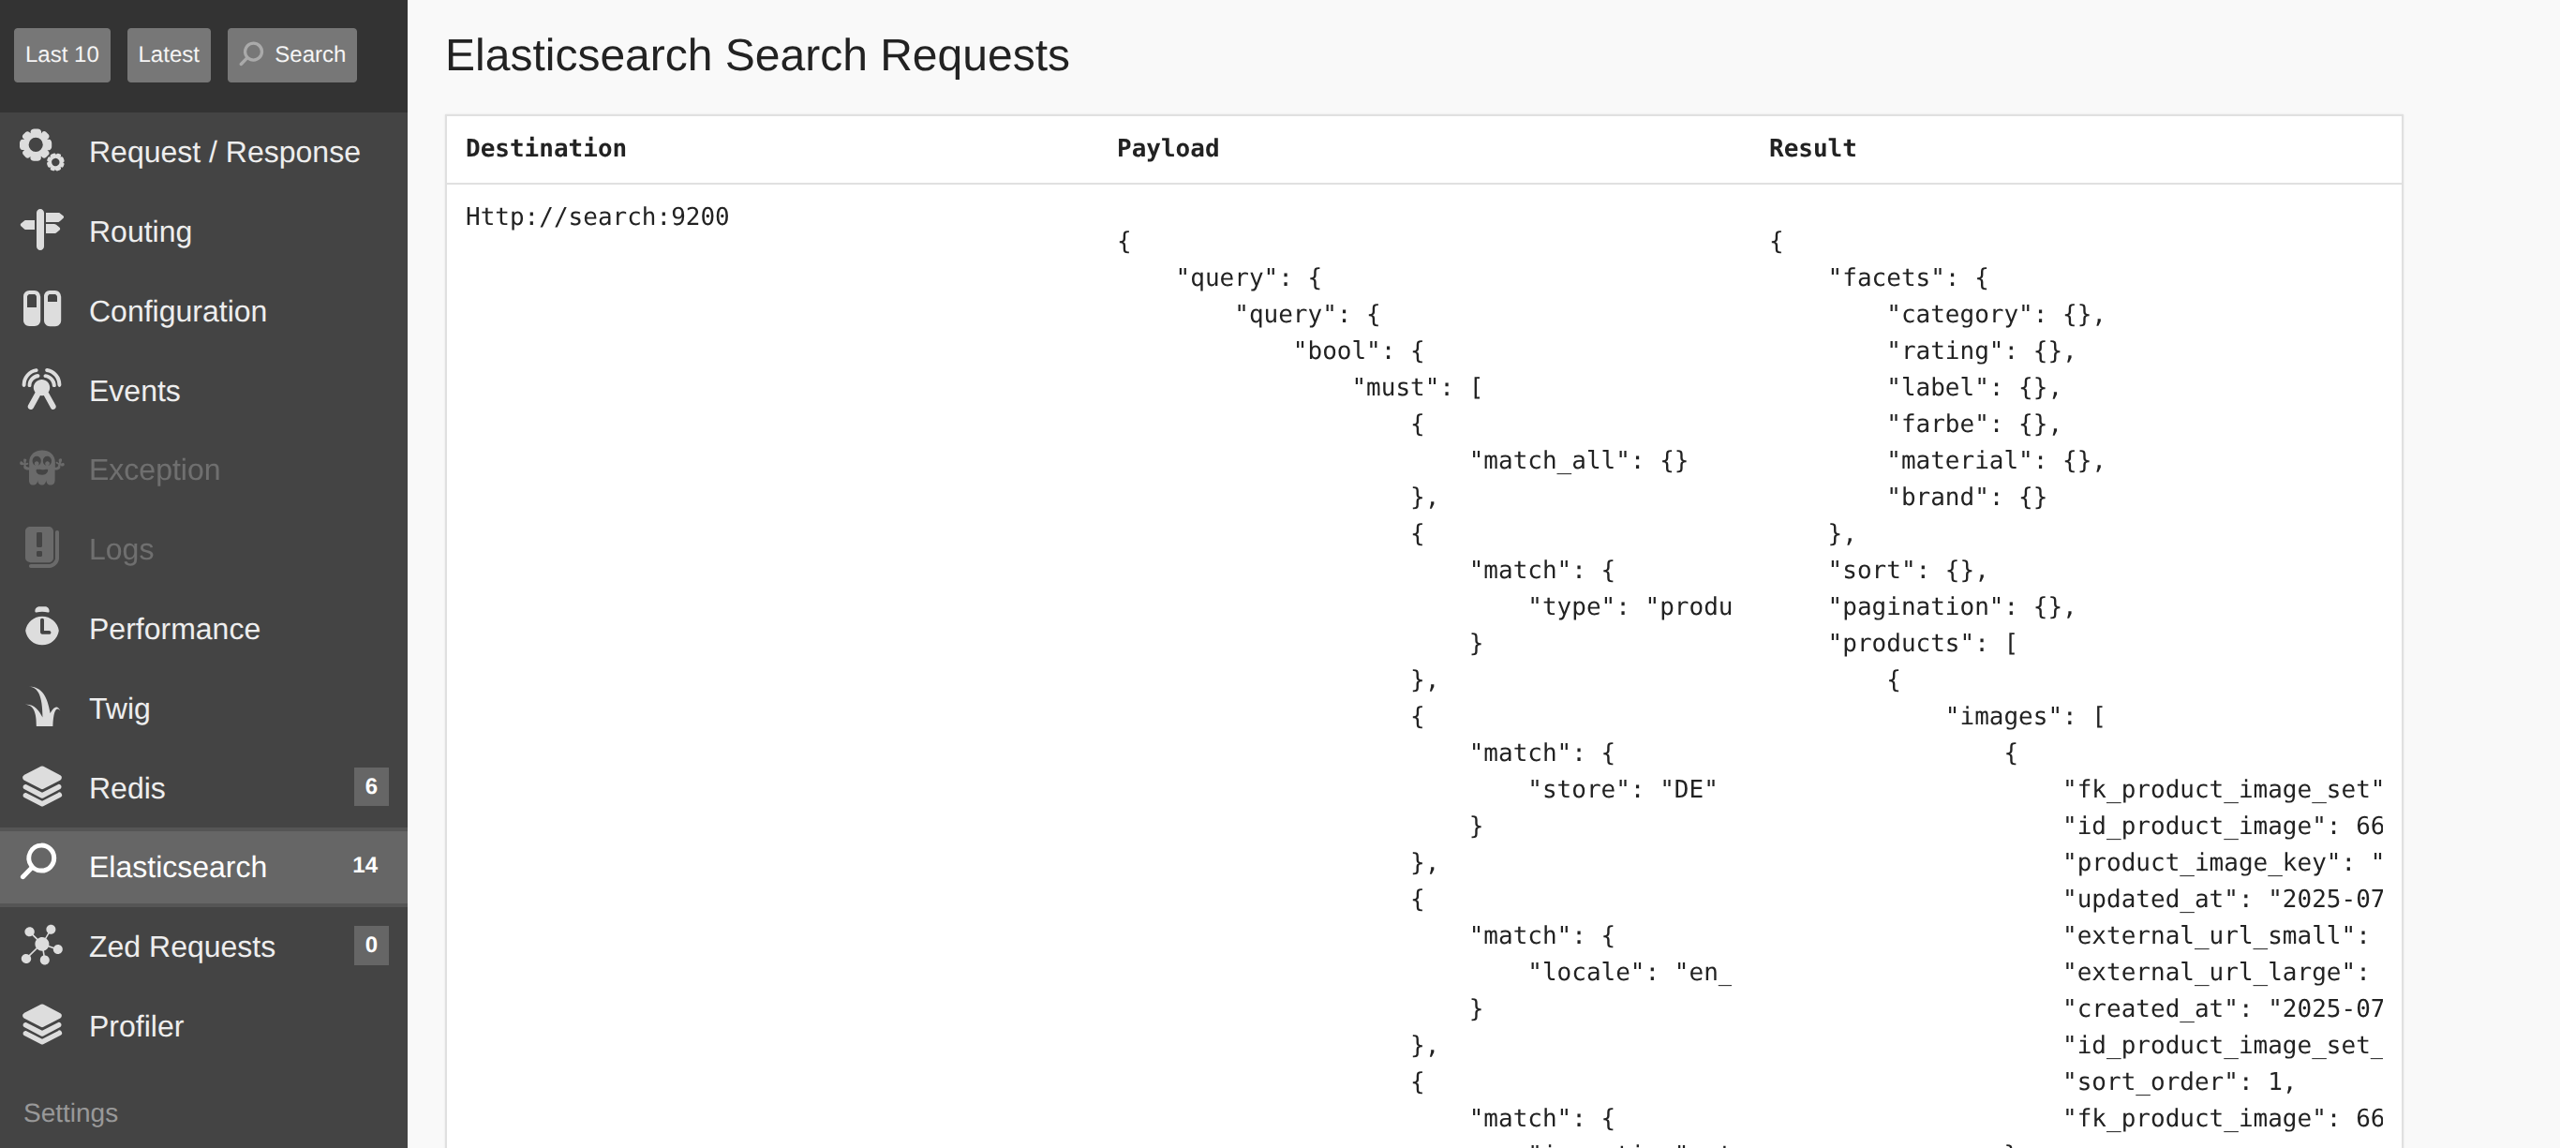
- Identify the destination - the URL where the search request is sent.
The profiler may show an incorrect endpoint. The correct one for the catalog page looks like this:
http://localhost:9200/spryker_b2b_dev_de_page/_search
Explanation:
localhost:9200 - defined in the deploy.dev.yml under the search configuration.
spryker_b2b_dev - the namespace also comes from deploy.dev.yml.
de_page - indicates the store (de) and the type of search.
-
Find the payload - the request body. It often contains more data than required because it is a full log output from
vendor/spryker/search-elasticsearch/src/Spryker/Client/SearchElasticsearch/Search/LoggableSearch.php::search(). -
To create a valid manual request, extract the query part from this payload.
In many cases, it is easier to get the destination and payload directly from the executed request inside:
vendor/ruflin/elastica/src/Transport/Http.php::exec()
- Once you have both the destination URL and payload, you can use any HTTP client, such as Postman, to make the request.
If the entity is missing from Redis or Elasticsearch, the synchronization step likely failed. Go back one step and check if the message was processed successfully.
5. Manually re-trigger sync
If something is missing, try re-publishing or re-synchronizing the data manually.
6. Getting information on listener and events used
When you need to know what events and which listener are used in your setup, you can use the event:dump:listener command. This prints a list of queue names, event names, and listener.
You can narrow down the list using the following options:
-
--event-names-only- prints all event names used -
--queue-names-only- prints all queue names used -
--event- prints all listeners attached to this event -
--queue- prints all listeners that will use the specified queue
Thank you!
For submitting the form