APM — New Relic based troubleshooting
Edit on GitHubEach performance degradation or downtime can be assessed based on metrics and data points that allow narrowing down the possible faulty components and identifying exact bottlenecks that require attention and change.
While this guide focuses primarily on using New Relic for most troubleshooting scenarios (which already covers 80–90% of typical cases), keep in mind that sometimes the root cause lies outside the application layer. In such situations, complementary data sources—such as AWS CloudWatch metrics, application logs, or visible application behavior (for example, browser-level errors or delays)—may provide additional helpful context. These sources are optional and should only be reviewed if New Relic does not fully explain the issue.
Why math matters: navigating performance metrics
To effectively troubleshoot a Spryker application using New Relic, you must look beyond “average” response times. In a complex e-commerce environment, averages are often deceptive; they mask the experience of frustrated users by smoothing out significant outliers. To gain a true architectural view of system health, rely on percentiles and statistical aggregates. These are not just mathematical jargon; they are tools that categorize your traffic by user experience.
- The Median (P50): This is the literal middle of your data. If your P50 is 200ms, it means exactly half of your users are experiencing speeds faster than that, and half are slower. It represents the “typical” user experience.
- P95 and P99 (The “Tail”): These represent the 95th and 99th percentiles, respectively. If your P99 is 5 seconds, it means 1% of your users—perhaps those with massive shopping carts or complex B2B pricing rules—are waiting a grueling five seconds (or more) for a page to load. In APM, focus on these “tails” because that is where the most critical performance bottlenecks and infrastructure strains are hidden.
- Maximum (Max): This is the single slowest request recorded. While often ignored as a “one-off” glitch, in a Spryker context, a high Max can indicate a specific worker timeout or a deadlock in the database that could eventually cascade into a full system outage.
Understanding these distributions lets you stop optimizing for the “average” and start solving for the “worst-case,” ensuring that even your most complex transactions remain performant.
The approach
The approach used at Spryker is “top to bottom” and, in short, can be described in the following points:
- Identify and review the high-level application component that misbehaves—for example: Yves, Zed, Backend-Gateway, or Glue API.
- Review top-level application metrics over the period of the last 1-7 days or during the period when the problem was observed. Such metrics may include: New Relic Apdex, average response time, error rate, and top 5 slowest transactions, top 5 slowest DB queries.
- For each of the top X slowest transactions, open a few example traces and review the execution call stack to identify the exact reasons for the problem—for example, DB query or slow component in a loop, or too many (hundreds to thousands) quick calls repeated in a loop within one request.
- Based on the evidence found in New Relic, proceed with code optimization or infrastructure changes to fix the problem or remove the bottleneck.
Last but not least, repeat the process over and over again. After each change (be it infrastructure or code), iteration is the key here. Some problems may not be visible while others (bigger ones) are at the top (iceberg analogy).
1. New Relic entities
The Spryker setup consists of several applications. It is important to understand on a high level which application may work slowly, or inefficiently, or is responsible for the problem that you are trying to solve. Sometimes it is easy—customers complaining about it, sometimes not, but usually it makes sense to start from an app that is an “entry point” to the Spryker stack from the internet.
Spryker architecture
Spryker applications that are the first ones to handle incoming traffic usually are: Yves (or Glue API or Marketplace) then Backend-Gateway, then Zed/the Back Office, then background jobs (Jenkins).
Architecture documentation about Spryker applications can be found here:
Spryker - New Relic integration
New Relic uses its own concept of “Applications” referred to as Entities. These act as logical containers for transactions and traces, and in the Spryker setup they effectively serve as aliases for Spryker application names.
Spryker integrates with New Relic through the community module spryker-eco/new-relic: GitHub - spryker-eco/new-relic (“eco” stands for “ecosystem”; see also Eco modules).
This module provides several useful features out of the box:
- Per-application trace separation—transactions and traces are grouped into different New Relic entities for each Spryker application (for example, Yves, Zed, Backend Gateway).
- URL-based transaction naming—transactions are named based on the URL segment (for example, “catalog”, “search”), instead of all being grouped under a generic index.php.
- CLI command-based transaction naming—commands such as
queue:worker:startoroms:check-conditionsare named explicitly, instead of all being grouped under a generic vendor/console.
How New Relic groups incoming traces into Entities depends on the configuration provided by the Spryker New Relic eco module. The default configuration works well and is summarized in the tables below. To highlight the effect of the module, the comparison tables show how New Relic groups transactions with and without the spryker-eco/new-relic module enabled.
New Relic default configuration (eco module is not present or not configured):
| NR Entity | Description |
|---|---|
| {project-name}-{env-name}-newrelic-app | Default Entity name coming from PHP’s NR configuration |
Spryker/New Relic configuration (eco module installed and wired-in):
| NR Entity | Description |
|---|---|
| {project-name}-{env-name}-newrelic-app | Default Entity name coming from PHP’s NR configuration, captures backend-gateway transactions, sometimes also Backoffice and CLI transactions. |
| YVES-{store-name} ({env-name}) | Yves |
| GLUE-{store-name} ({env-name}) | Glue, for example GLUE-US (docker.production) |
| ZED-{store-name} ({env-name}) | Zed / Backoffice |
| MERCHANT_PORTAL-{store-name} ({env_name}) | Merchant Portal |
How to integrate New Relic
Minor adjustments are necessary on a project level to get the full benefit from the Spryker New Relic eco module:
- Install the module and configure Spryker apps (Yves, Zed, etc) as separate New Relic entities: Configure services.
- Grouping console commands in New Relic by names: New Relic transactions grouping by queue names.
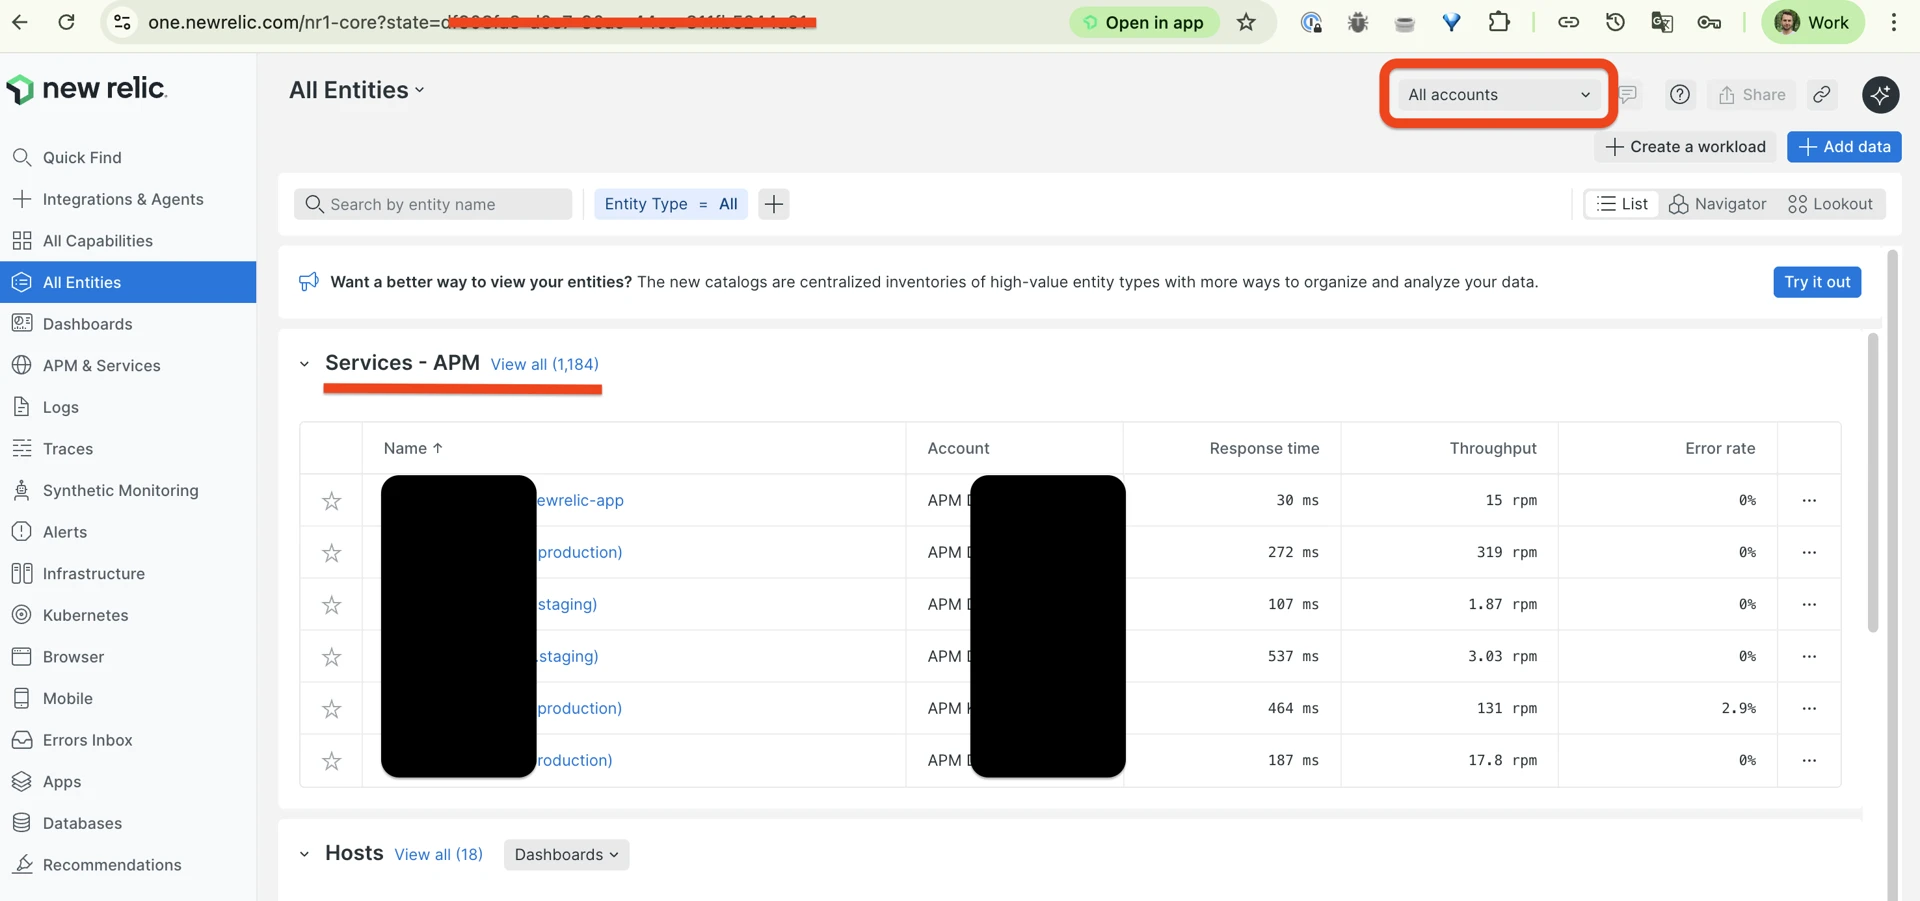
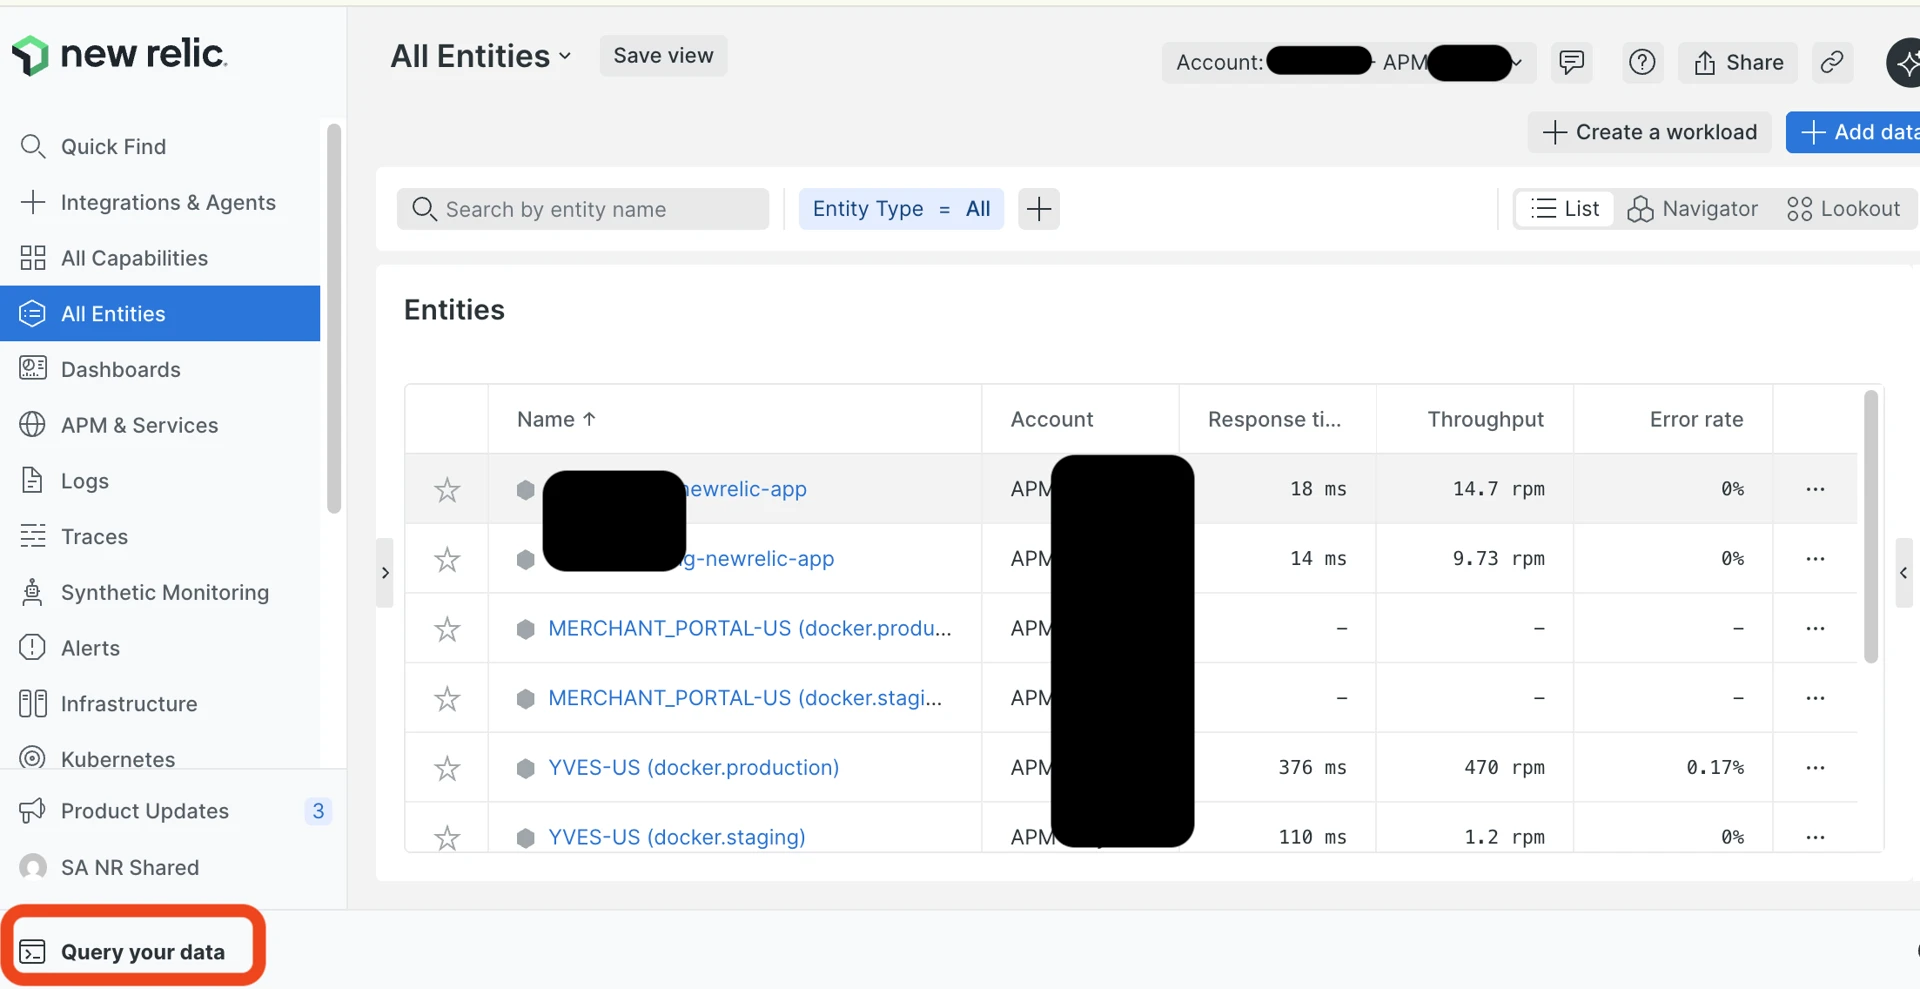
With proper integration, as described in the above-mentioned documentation articles, New Relic “Entities” within an account look like this:
Main New Relic screen after login. Highlighted with red: Account selector and “Services - APM” list of New Relic entities:
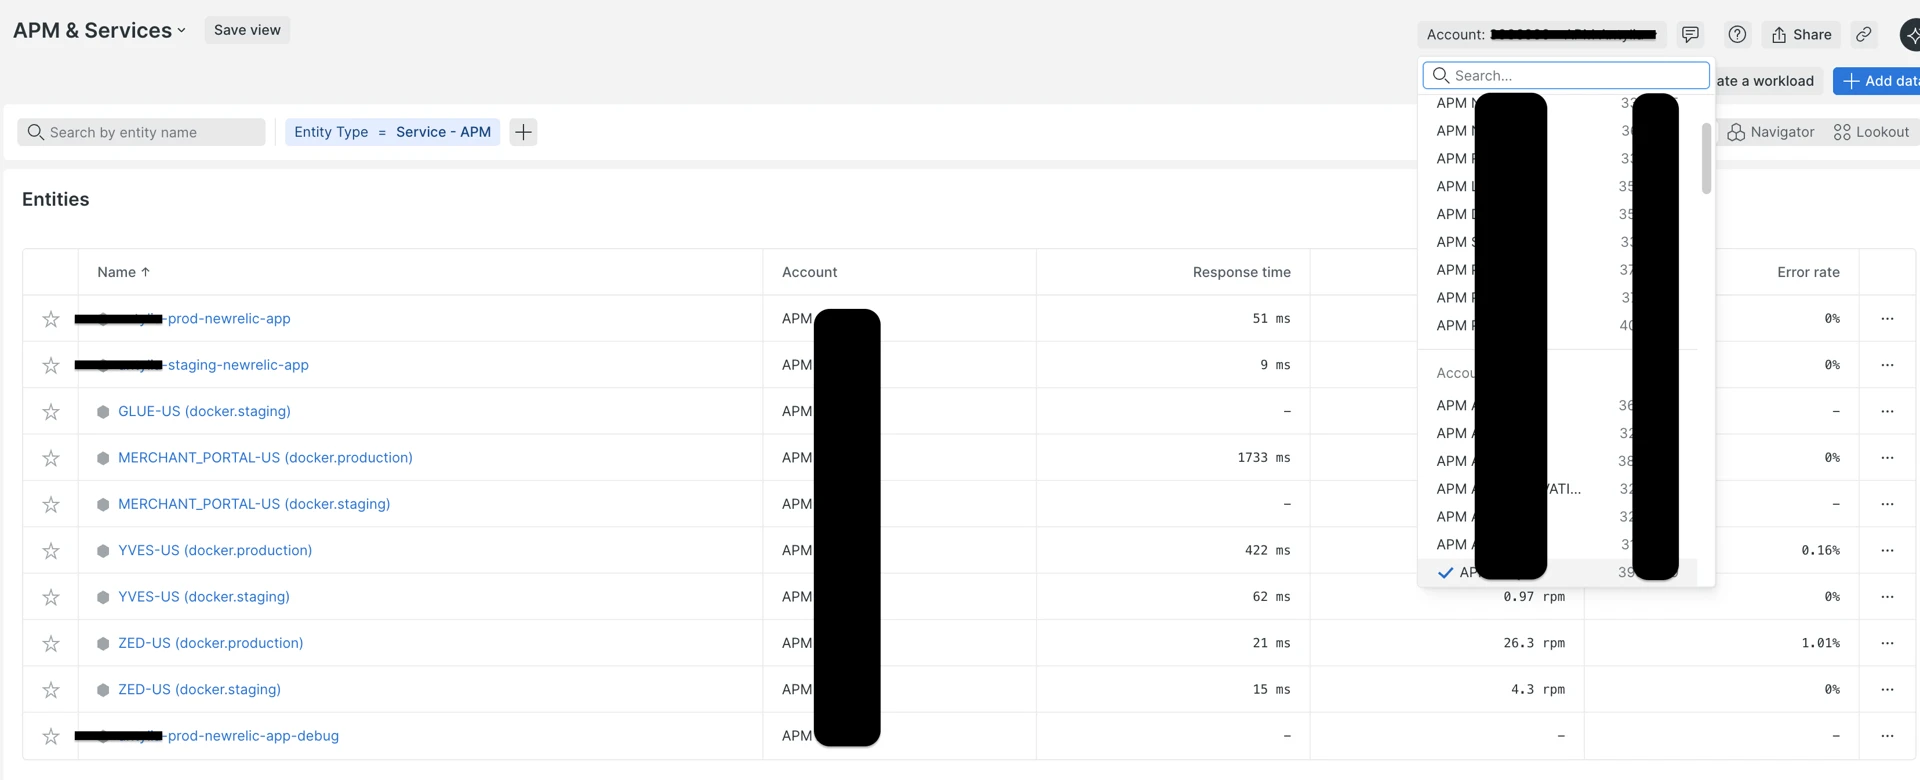
New Relic “APM & Services” list and APM account selector:
2. Review high-level metrics (1–7 day window)
As described in The approach section, each New Relic Entity (application) has a set of the most important metrics that are shown for each transaction, and some of them for an Entity as a whole.
These metrics let you quickly get an idea of application performance state and assess how good or bad it is, and whether or not deeper investigation or intervention is required.
| Metric | Where in NR | What it tells you |
|---|---|---|
| Apdex | Summary page | Overall user satisfaction score calculated by New Relic. |
| Avg response time | Summary page | Average response time, including all very fast and very long queries that may be rare. Gives high level understanding of the “temperature”, but does not answer the questions like “are there problems” or “what is the impact”. |
| Error rate % | Summary page > Errors, or “Errors (errors inbox)” in the left menu | Spryker sends only PHP-generated exceptions to New Relic. Ideally, there should be no errors at all, but if it is low and does not affect much of requests, maybe the problem is not that critical. |
| Throughput (rpm) | Summary page | Information on traffic volume (the average value and the graph over the period) allows to correlate potential performance problems with increased traffic or refuting this correlation. |
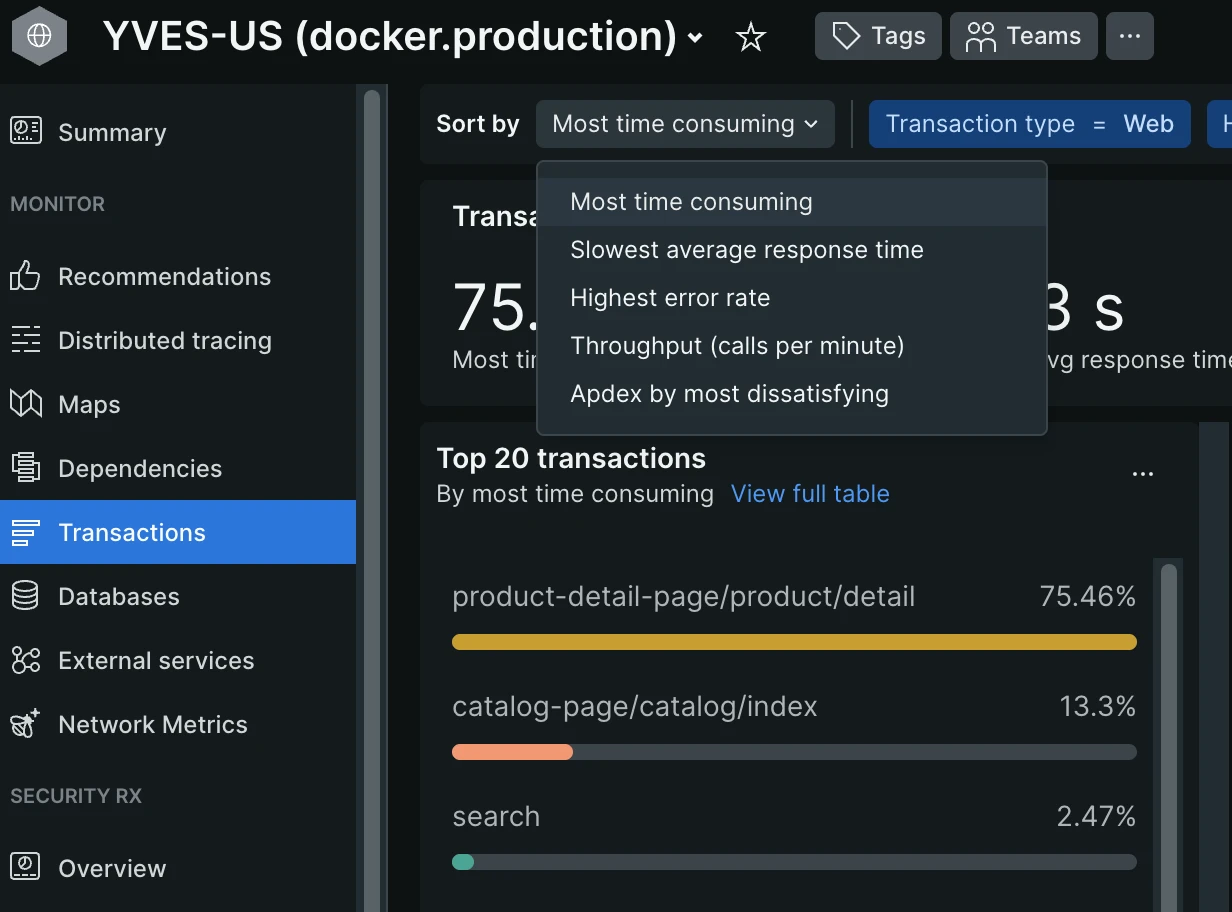
| Top 5 slowest transactions | Transactions > Sort by “Most time consuming” | Where is the time being spent the most. Calculated as the number of requests multiplied by the average response time. |
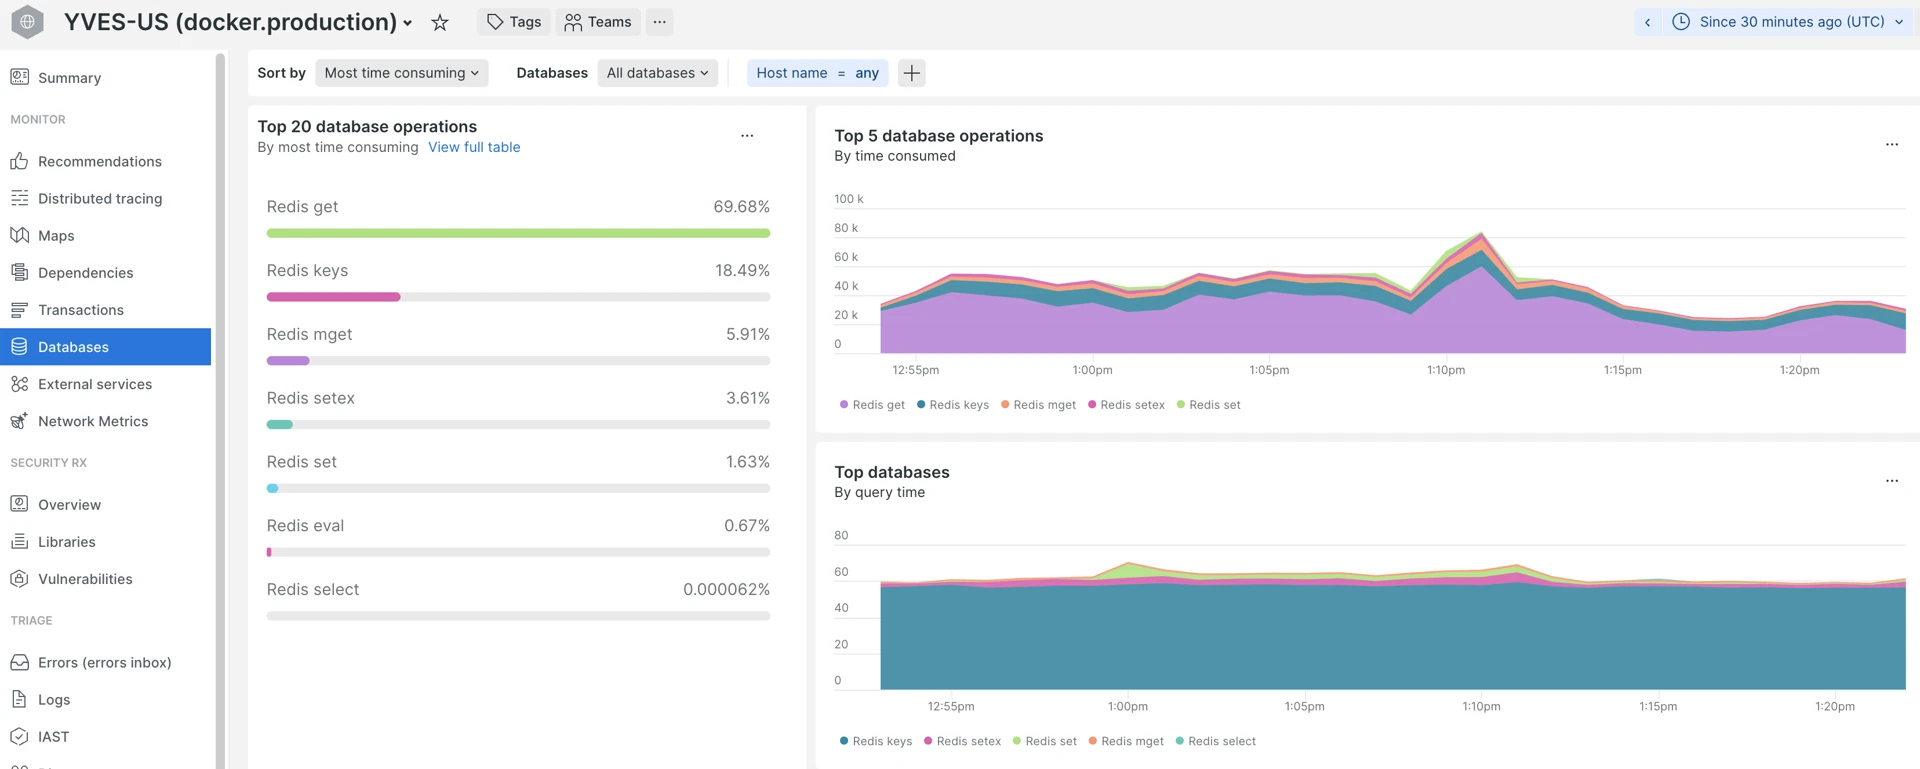
| Top 5 slowest DB queries | Databases > Sort by “Most time consuming” | DB bottlenecks. |
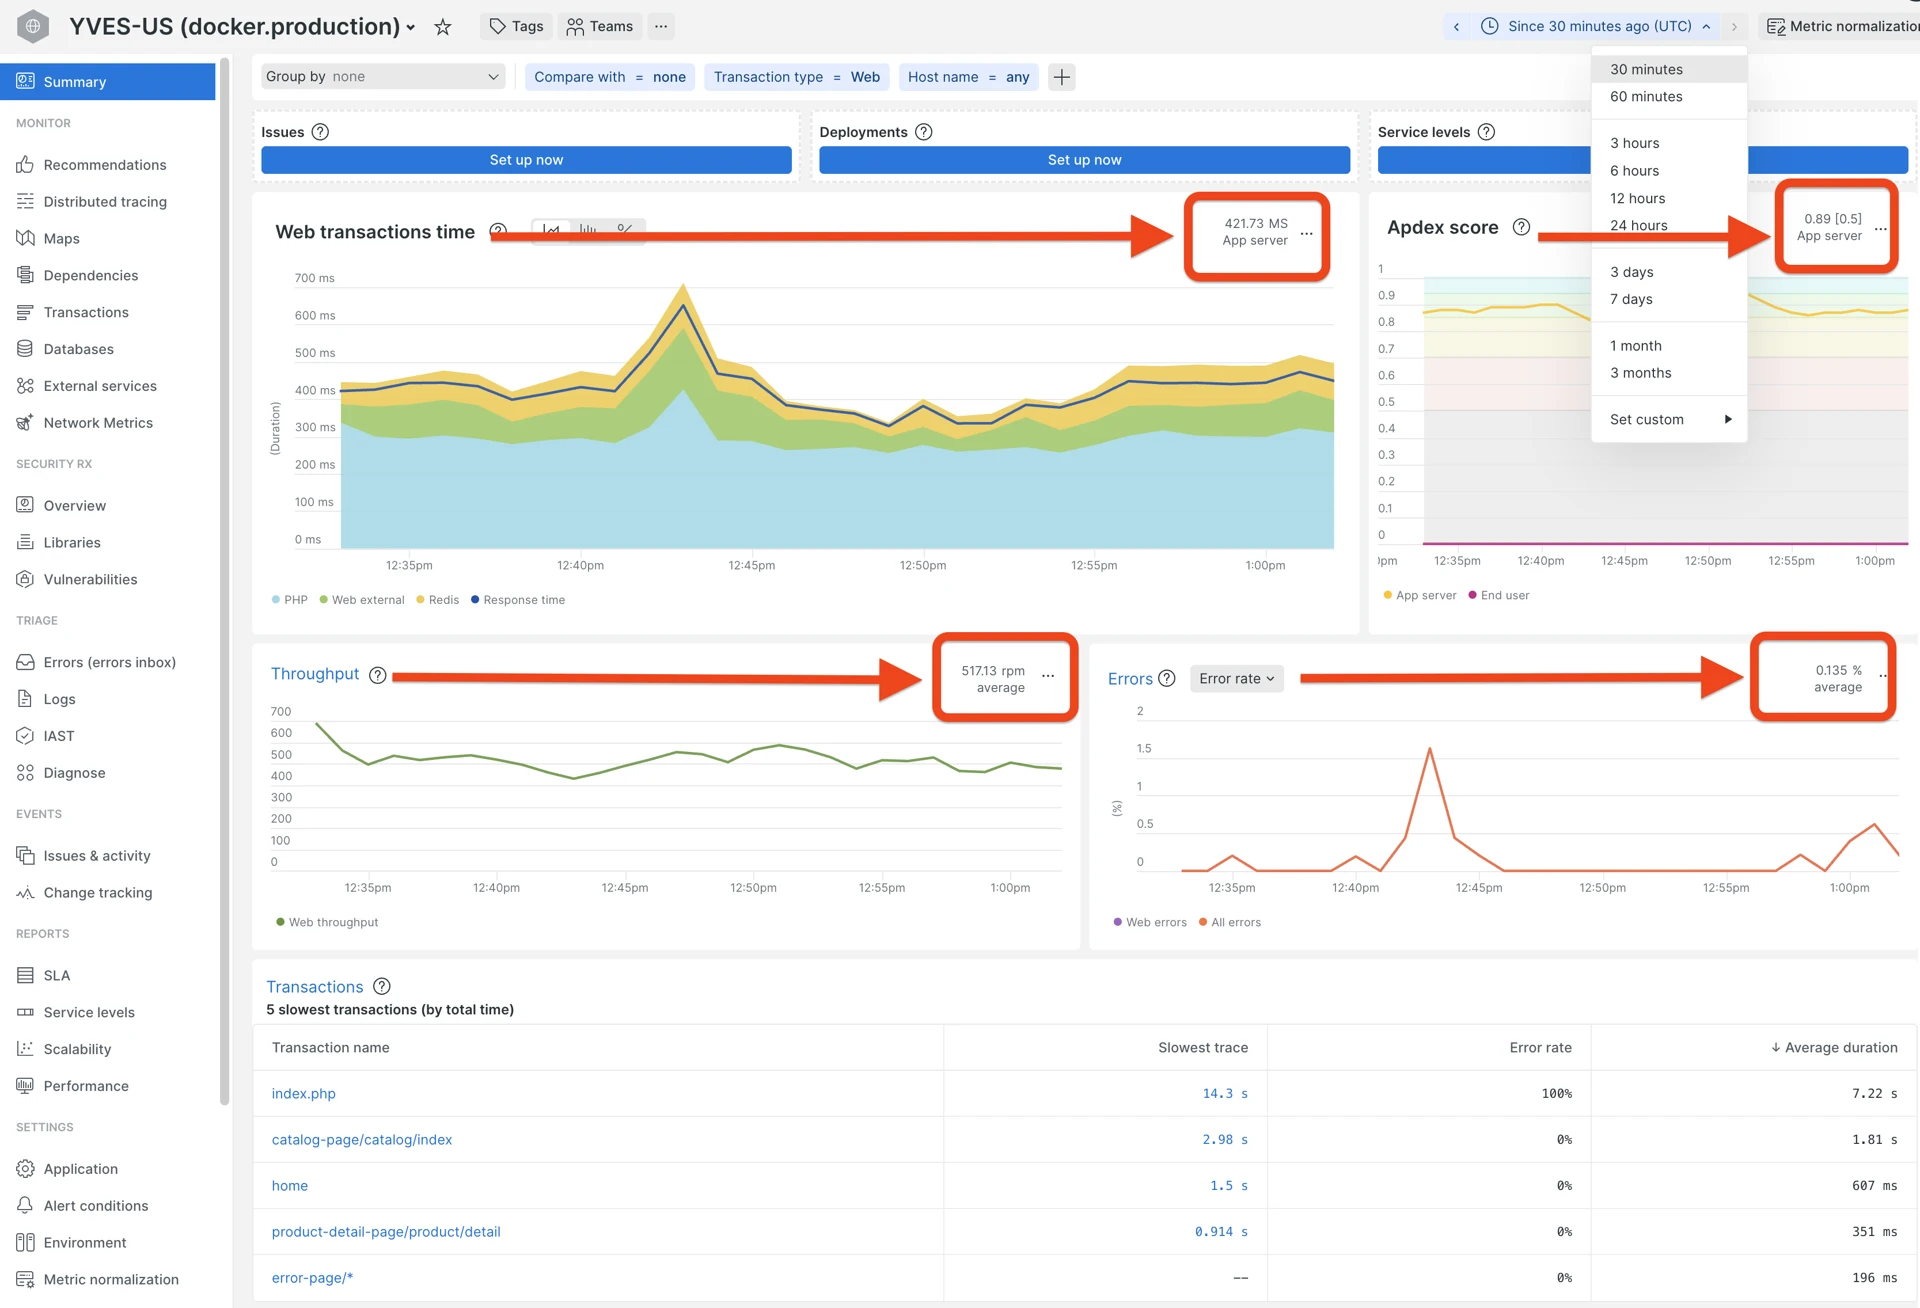
New Relic Summary page with Apdex, response time, throughput, and error rate:
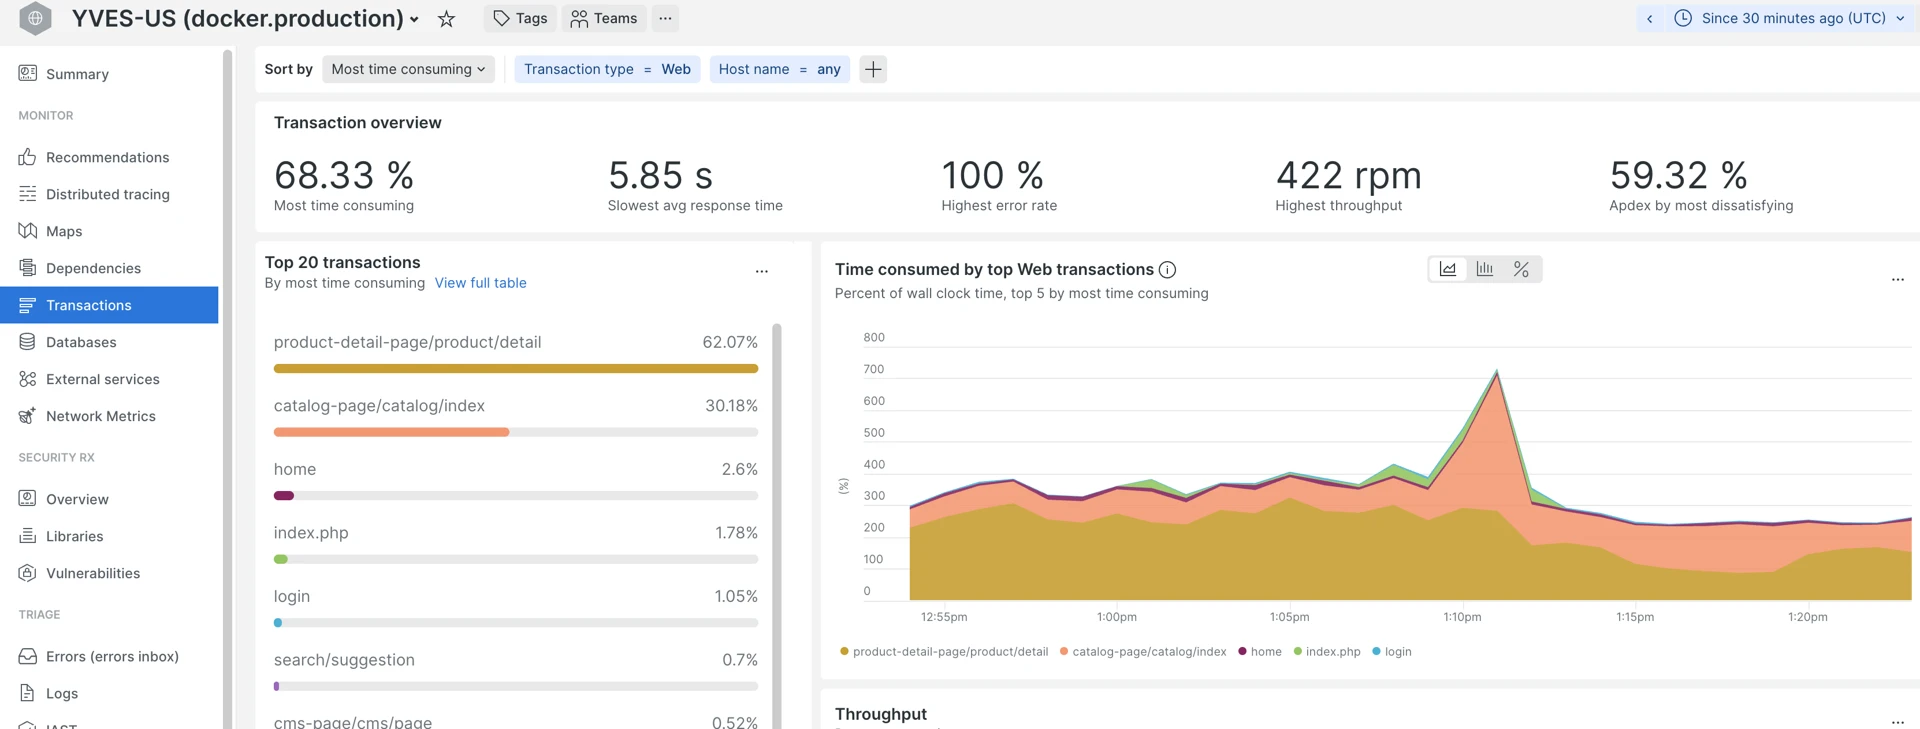
Transactions page sorted by “Most time consuming” — look for the top 5:
Databases tab sorted by “Most time consuming”. For the Yves app it is mostly Redis/ValKey, for the Back Office or Gateway — RDS SQL queries:
Web transactions vs CLI
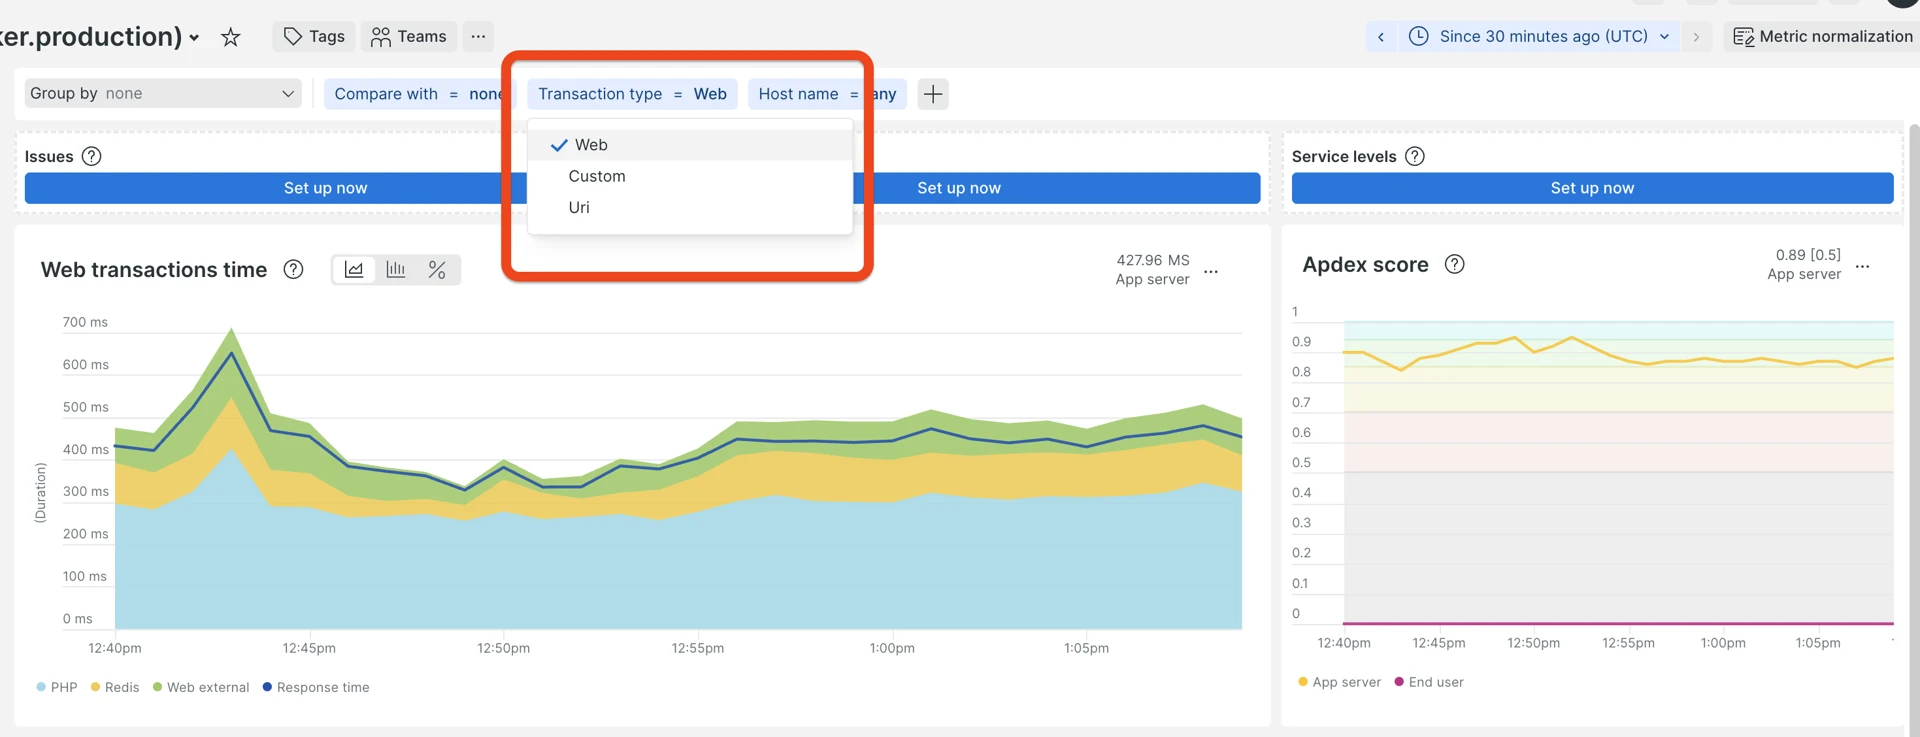
Check Web transactions vs Non-web (CLI) separately—CLI includes schedulers, consumers, data importers. A slow CLI job does not affect storefront Apdex, but can exhaust DB connections or CPU. Sometimes, there could be options like “Custom” and “Uri”, which are other views on web requests and are not used much within Spryker applications monitoring.
The Web/non-web toggle is at the top of almost every page:
Thresholds - How to decide what to analyze
At this point, you may be distracted by the amount of available data and unsure which transactions to investigate deeper.
Official documentation for how to diagnose transactions with an explanation about different sorting options is available here: Diagnose slow transactions.
There is no single “golden rule” here in terms of exact numbers, but there is an approach that helps to prioritize:
- Start by checking the top 3 to 5 for each of those lists:
- “Most time-consuming”—combined metric of the number of requests per transaction with an average duration, meaning how long (in % of the selected period) the app was processing that particular transaction time. The top 5 are good candidates for further analysis.
- “Slowest”—slightly different perspective of transactions sorted by average response time over the period. The top 5 in this list are the second priority, because here the amount of requests is not taken into account, meaning that a transaction which is slow on average may not produce that big an impact that would justify further investigation.
- “Highest error rate”—transactions that have the highest % of errors out of all registered requests. Ideally, there should be no errors (uncaught exceptions), but in real life application, there are always some errors happening; the problem is—how many?
The “Sort by” dropdown lets you switch between those sorting modes:
- Review the top indicators—for each transaction (from the candidates defined in the previous step), click on each one and check:
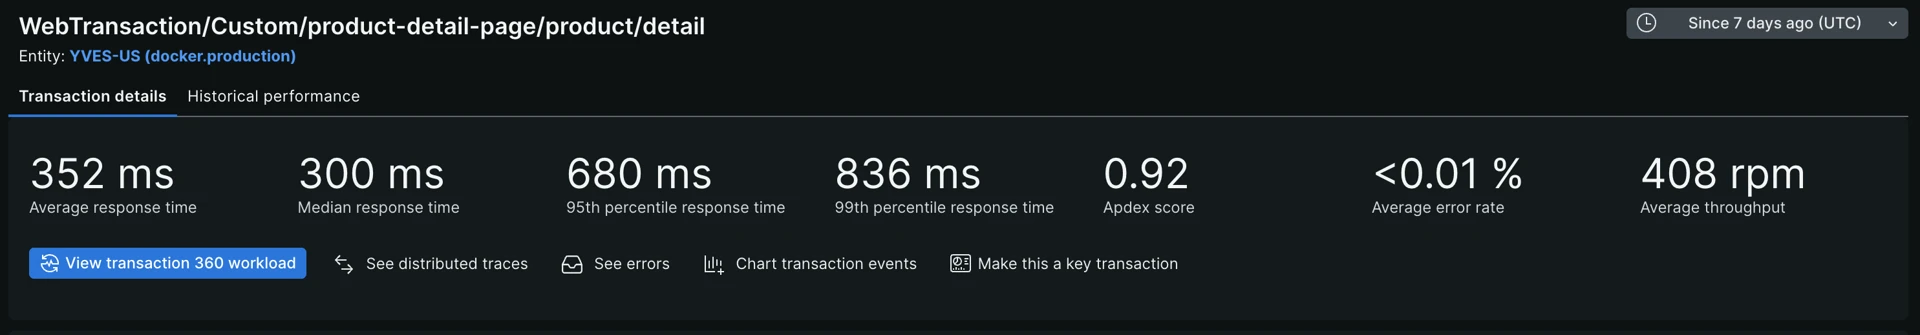
- Average response time—gives an idea of how good it is on average, but not that useful, because you may have too broad a spectrum of response times, for example from a few dozen milliseconds to even a minute.
- Median—it is 50th percentile, it means half of the requests were faster and the other half—slower.
- 95th, 99th percentile—how fast were 95% and 99% of all requests.
- Average error rate and Apdex.
Transaction statistics — high-level performance indicators. The same data can be collected by executing a New Relic query provided in the Useful New Relic query section below for multiple transactions:
- Now, depending on business needs, priorities, and time available, you may decide which transactions are the most critically affected in terms of poor performance. That approach of reviewing summaries helps to save time on avoiding analyses where it is not necessary and concentrate on problems that are really impactful (if any). You can translate those metrics to more human language as:
- Median (half of all requests, 50%) response time is above 2 seconds.
- 95% of requests are faster than X1 seconds (New Relic metric P95 showing the time bucket that 95% of all requests fall into, for example, number of requests that are faster than X seconds).
- 99% of requests are faster than X2 seconds (P99, 99th percentile, 99% of requests faster than … seconds).
- Only 4% of requests are in a range from X1 to X2.
- While the maximum response times visible for sampled transactions in the Traces section may be to even bigger numbers, for example, X3 seconds, you know that only 1% of requests fall into this range from X2 to X3, because you know what the 99% boundary is.
The provided numbers are just examples. Exact thresholds should be discussed according to project quality requirements to assess how critical it is. Despite “the faster the better”, in real-life projects, it is not always viable to spend resources on optimizing 1% of all requests that are slower than some acceptable number like 1.5 seconds.
3. Drill into traces
There is a good official guide explaining how to read and analyze transactions in New Relic: Diagnose slow transactions.
After the previous step, you should already have an idea of which apps and which transactions do not perform as well as desired and by how much.
The next step is to go deeper into actual Spans (the components of a Trace) to understand where the actual bottlenecks are and why it happens. Despite the unique nature of each project, most of the performance-related issues are coming from a limited set of bad practices or patterns described below.
| Pattern | What you see in a Trace | Likely cause |
|---|---|---|
| One huge/slow DB query | Single span 2+ seconds | Missing index, full table scan |
| Hundreds of small DB calls | 50–1000+ identical or similar short spans | N+1 query—loop hitting DB per item |
| Extreme outliers | P99 is 5x+ larger than P95 | Conditional code paths, rare data shapes |
| Timeouts | MAX is 10x+ larger than P99 | Infrastructure hang, PHP-FPM starvation |
| Slow external call | HTTP/external span taking seconds | Third-party timeout (payment, search) |
| High app time, low DB | 90% time in app spans, a few DB calls | CPU-bound: hydration, serialization, rendering |
| High DB ratio, few queries | 50% DB time, <20 SQL queries | Heavy unoptimized queries, lack of “cached” information in the key-value storage. |
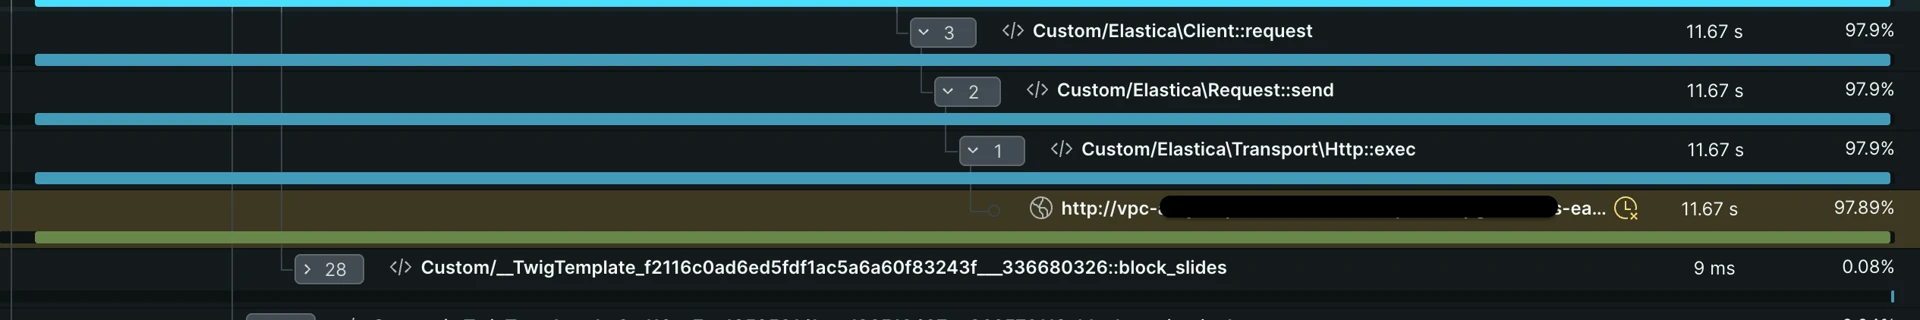
Slow external request — in this case, a query to the OpenSearch search engine. The two most popular reasons are heavy custom queries or undersized infrastructure for the workload/traffic:
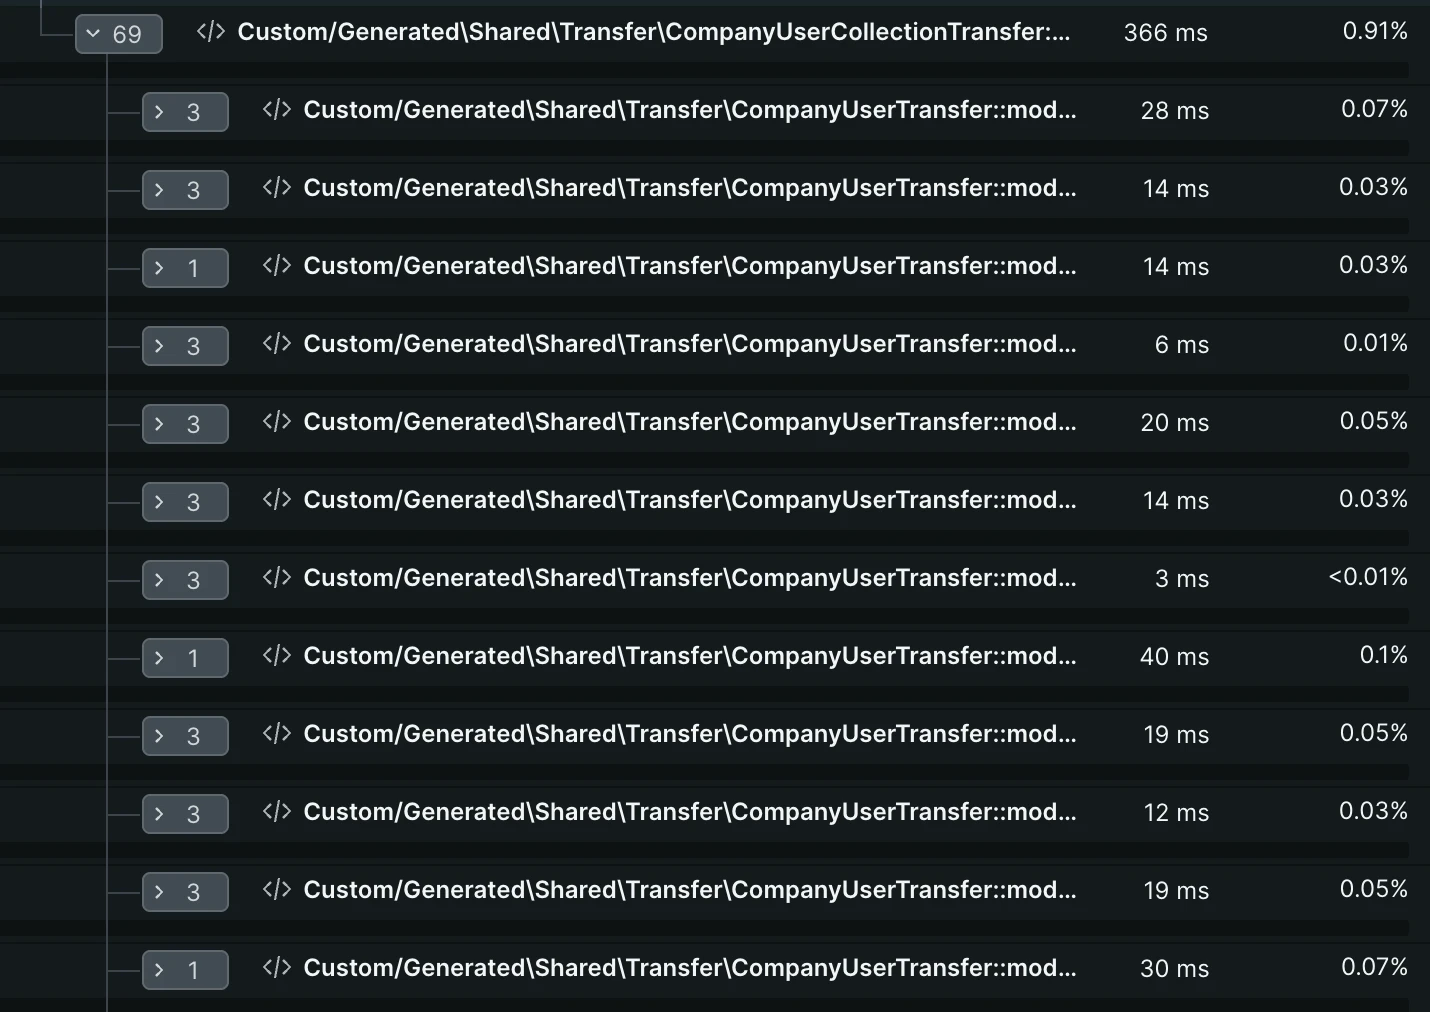
Example of quick operations processed in a loop many times. Such a case may also be about DB queries, HTTP requests, or any heavy logic:
When there are no outliers
Sometimes, when examining a slow example trace, you may notice there is no single outlier—all components (spans) are more or less taking the same time to execute.
What it means (most likely):
- A compute node is overwhelmed or undersized for the task.
- Misconfigured application on a ground base level—for example: Composer autoload is not optimized, URL or class cache is not built, etc.
- Short period of multiple events overlapping, such as: deployment (old containers were removed, while new ones are not yet handling the load), bot activity, wrong configuration.
- Last option: all the logic is not efficient and is heavy (seldom).
4. Errors Inbox
When the error rate is elevated:
- Go to Errors Inbox and group by error message.
- Check first/last seen—does it ring a bell, is it something that appeared after the recent deploy?
- Open example occurrences and review the stack trace.
- Correlate with deploy events (known from AWS, communication with a development team, or other sources).
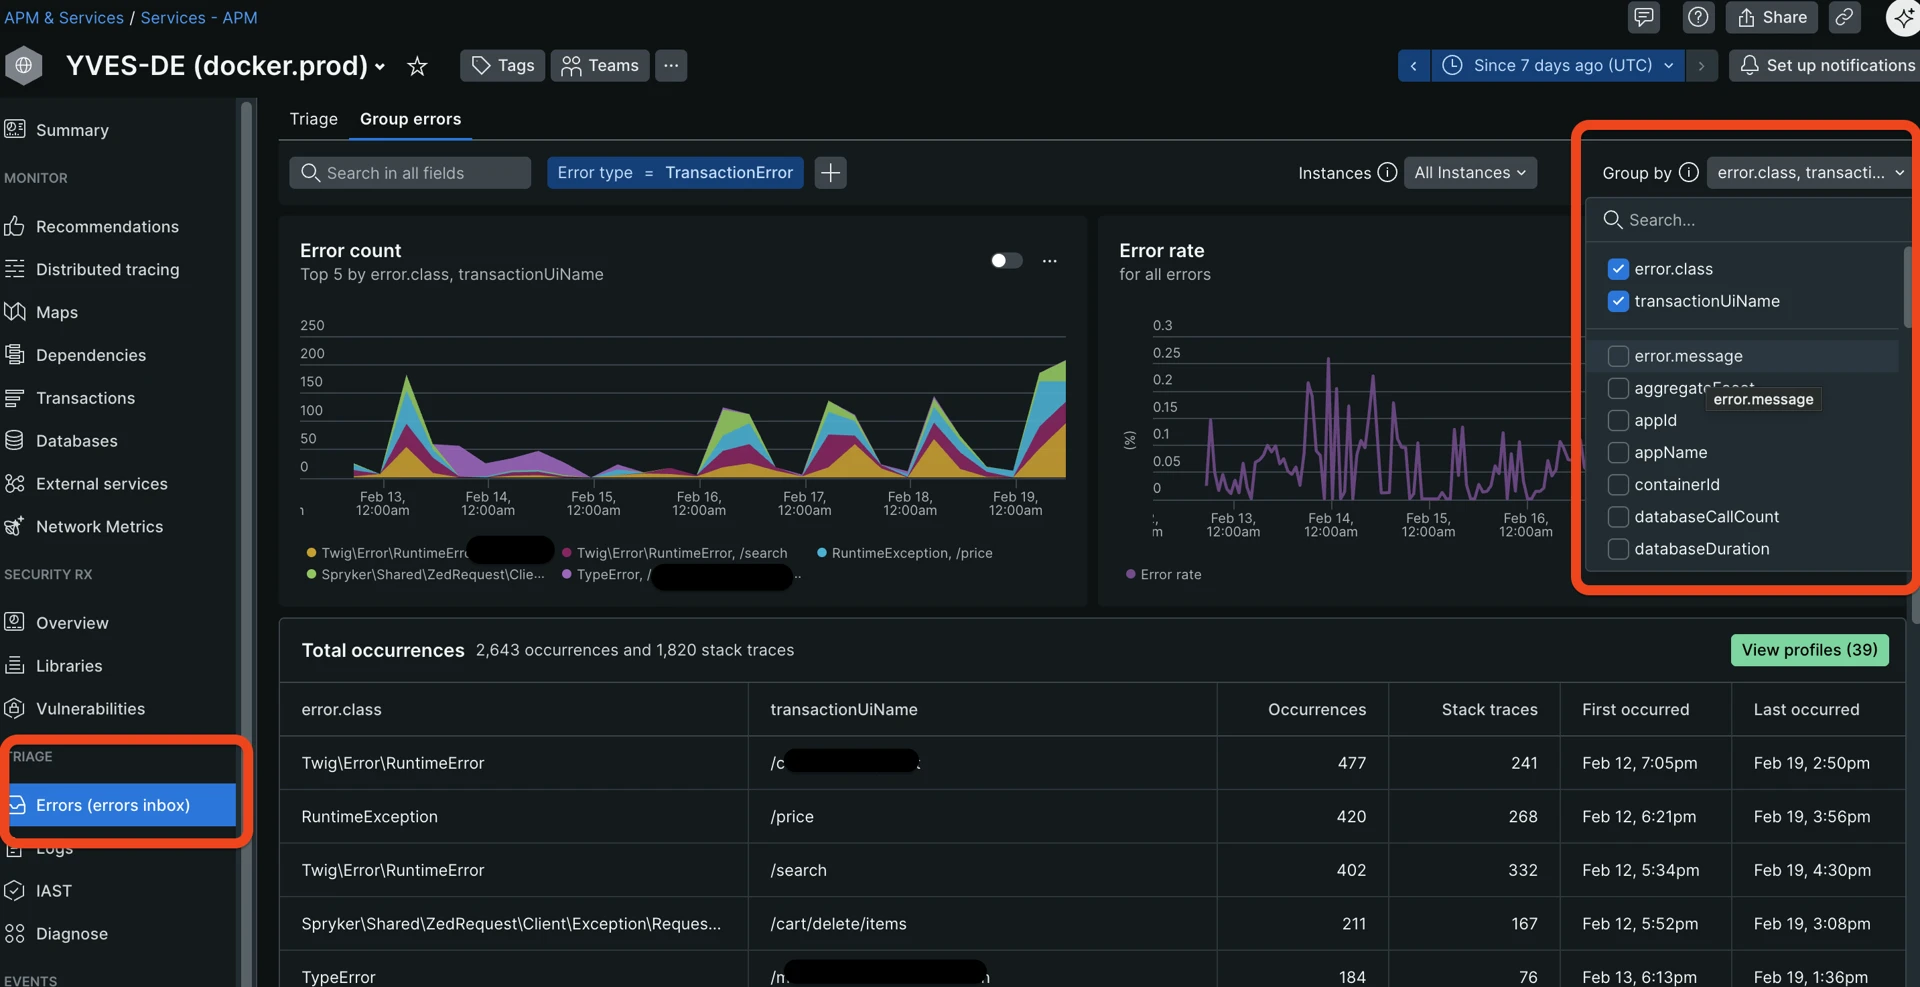
The error inbox and “Group by” dropdown help you understand what kind of errors happen most often and where:
A few useful tips:
- Uncheck
error.message—it is a full message that may contain lots of details and unique content such as hashes, which does not allow for effective grouping.error.classprovides enough high-level information for grouping. - Sometimes it is beneficial to add such attributes as:
request_uri—to understand where an error happens more often, potentially spotting problematic pages.request.headers.referrer—where the requesting client came from before the error.request.headers.userAgent—to check whether most of the errors are generated by one or a few user agents like bots or scanners.
- There is no strict threshold here, look for any outliers.
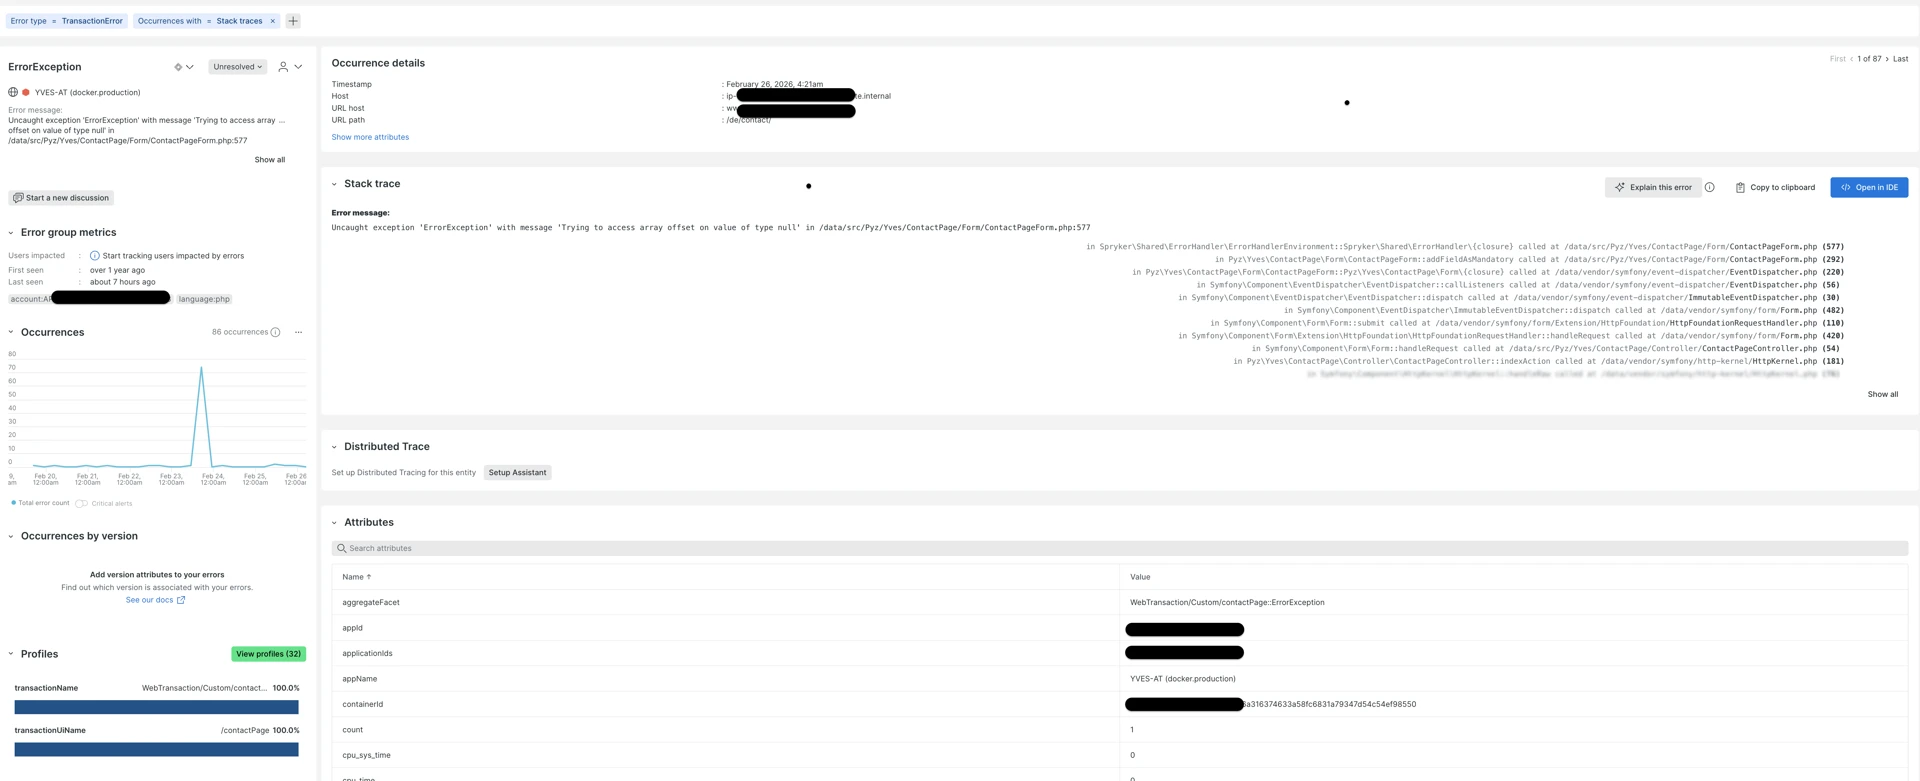
Clicking on each error title from the “Error Inbox” screen leads to the detailed Error information page, showing useful context:
- When was the first and last time the error happened.
- Transaction URLs where it happens the most.
- Stack trace showing the exact execution path in an app that led to the error.
- Occurrences over the period—how often it repeats.
Detailed example of a captured exception with detailed information:
5. Iterate (Iceberg analogy)
After fixing the top bottlenecks:
- Re-run previous steps within 24–48 hours.
- The next bottleneck becomes more visible after the biggest one is removed, due to how APM tools are sampling and filtering traces.
- Track progress: compare Apdex and P95 week-over-week.
Useful New Relic query
Almost on each page in New Relic, there is a tab at the bottom called “Query your data” which lets you execute New Relic queries (NR query language similar to SQL) against a selected account and application:
New Relic query and results table. The “Chart type” selector lets you view results as a table, graph, JSON, or CSV:
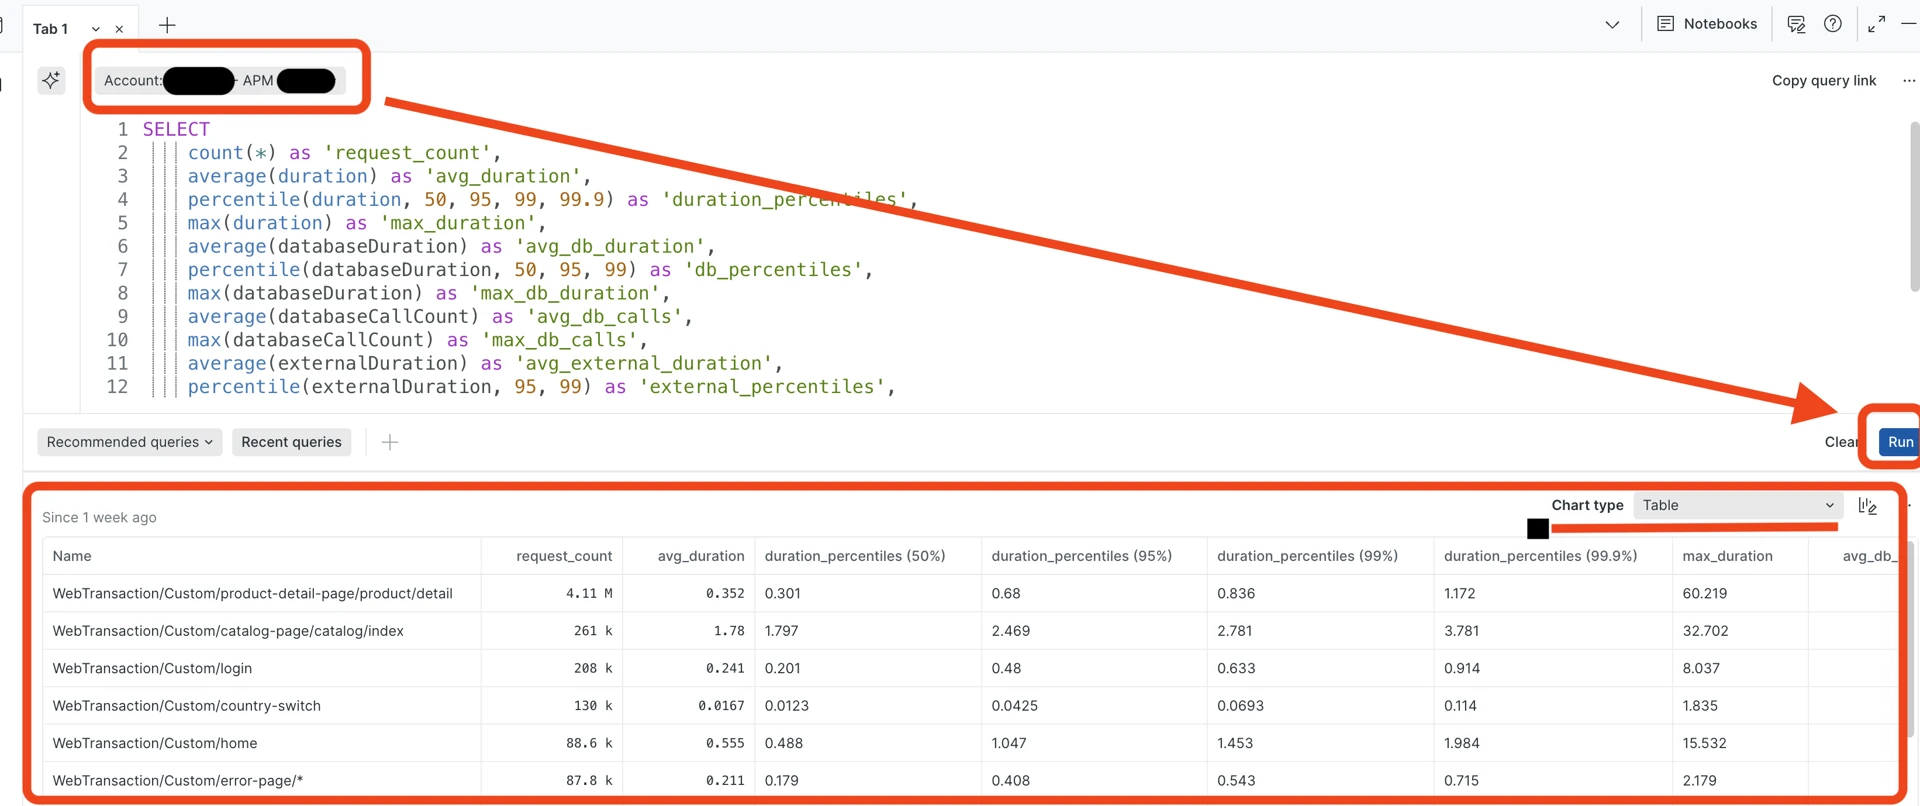
The following NRQL query provides a full metrics snapshot for transactions:
-- NRQL: Full metrics snapshot
SELECT
    count(*) as 'request_count',
    average(duration) as 'avg_duration',
    percentile(duration, 50, 95, 99, 99.9) as 'duration_percentiles',
    max(duration) as 'max_duration',
    average(databaseDuration) as 'avg_db_duration',
    percentile(databaseDuration, 50, 95, 99) as 'db_percentiles',
    max(databaseDuration) as 'max_db_duration',
    average(databaseCallCount) as 'avg_db_calls',
    max(databaseCallCount) as 'max_db_calls',
    average(externalDuration) as 'avg_external_duration',
    percentile(externalDuration, 95, 99) as 'external_percentiles',
    filter(count(*), WHERE error IS true) as 'error_count',
    apdex(duration, t: 0.5)
    FROM Transaction
    WHERE appName = '{APP_NAME}' -- auto-complete, helps based on selected account
    SINCE 7 days ago
    FACET name
    LIMIT 20
Replace {APP_NAME} with the actual New Relic Entity name for your application.
Bottleneck detection rules (quick reference)
When looking at New Relic dashboards, use these rules of thumb to quickly identify where the “smoke” is coming from. Think of these as diagnostic shortcuts rather than rigid math equations.
How to read these tables:
- P95/P99/max: Focus on these to see the “worst-case” reality for your users.
- The Ratio: If one part of the bar chart (span)—for example, database query—takes up more than half the time, that is your primary bottleneck.
- The “N+1” Check: In Spryker, strive for lean requests. If you see dozens of database (RDS, Redis/ValKey or ElasticSearch/OpenSearch) queries for a single page load, look for missing “Eager Loading” in your Query Containers, mget requests for key-value or restructuring search queries to retrieve data from one query instead of multiple.
User experience and scale
| Red Flag | Trigger | What is likely happening |
|---|---|---|
| The “Sluggish” Route | P95 is over 1s | The vast majority of users are feeling a delay. The code path is generally inefficient. |
| High Impact Bottleneck | Slow speeds affecting >10% of traffic | This is your top priority. A popular page (like Homepage or Catalog) is slowing down the whole site. |
| The rare events | P99 is 5x slower than P95 | Only a few users are hit, but they are hit hard. Likely a rare “edge case” or a very specific, huge B2B customer account or inefficient logic that is triggered rarely. |
Database and data strategy
| Red Flag | Trigger | What is likely happening |
|---|---|---|
| Database Heavy | DB takes up >50% of total request time | Your PHP code is waiting on the database. You likely need better indexes or query optimization. |
| The “N+1” Trap | More than 50 DB calls per request | Classic Spryker Issue: You are likely fetching items in a loop instead of using a Join or a multi-get. |
| Cache Miss Storm | High DB time, but very few DB calls | The DB is working hard on just a few things. Data that should be in Redis/Key-Value is fetched from backend-gateway, forcing a slow DB lookup. |
Infrastructure and external services
| Red Flag | Trigger | What is likely happening |
|---|---|---|
| Infrastructure Hang | Max time is 10x slower than P99 | Can mean that PHP-FPM is reaching its limit under the load, or rare edge cases. |
| Third-Party Calls | External calls >70% of time + Errors | It is not your code; it is the payment provider, ERP, or shipping API that is failing or lagging. But you have the power of moving this logic to a background job. |
| Resource Exhaustion | High App time, but NO DB or External calls | The server is “thinking” too hard. Likely heavy Twig rendering or complex price calculations hitting CPU close to limits. |
Resources
Thank you!
For submitting the form