Integrate Web Profiler Widget for Yves
Edit on GitHubThe Web Profiler Widget provides a toolbar for debugging and for informational purposes. The toolbar is located at the bottom of a loaded page.
The widget is based on Symfony Profiler. For details, see Profiler documentation.
Modules
The following modules provide the profiler functionality:
- WebProfilerWidget -
spryker-shop/web-profiler-widget - WebProfilerExtension -
spryker/web-profiler-extension
Installation
Install WebProfilerWidget and the extension module:
composer require spryker-shop/web-profiler-widget --dev
Integration
To be able to use the Web Profiler Widget, add \SprykerShop\Yves\WebProfilerWidget\Plugin\Application\WebProfilerApplicationPluginof thespryker-shop/web-profiler-widgetmodule to \Pyz\Yves\ShopApplication\ShopApplicationDependencyProvider::getApplicationPlugins().
Configure WebProfilerWidget per environment
The below options can be used in the Router to configure WebProfilerWidget. The options are contained in \SprykerShop\Shared\WebProfilerWidget\WebProfilerWidgetConstants.
\SprykerShop\Shared\WebProfilerWidget\WebProfilerWidgetConstants::IS_WEB_PROFILER_ENABLED- use this option to enable/disable WebProfilerWidget. By default, the widget is disabled.\SprykerShop\Shared\WebProfilerWidget\WebProfilerWidgetConstants::PROFILER_CACHE_DIRECTORY- use this option to specify the path where the WebProfiler stores its cache.
Extending WebProfilerWidget
You can extend WebProfiler with the \Spryker\Shared\WebProfilerExtension\Dependency\Plugin\WebProfilerDataCollectorPluginInterface interface. It can be used for adding Data Collectors to the profiler.
Individual Data Collectors can be added to \Pyz\Yves\WebProfilerWidget\WebProfilerWidgetDependencyProvider::getDataCollectorPlugins().
Spryker provides a lot of build-in collectors. You can locate them in WebProfilerWidget/src/SprykerShop/Yves/WebProfilerWidget/Plugin/WebProfiler/.
Additional collectors
Starting from version 3.17.0, the spryker/zed-request module allows you to collect data about all the requests to Zed sent from Yves.
To enable the data collection, add \Spryker\Yves\ZedRequest\Plugin\WebProfiler\WebProfilerZedRequestDataCollectorPlugin to the stack returned by \Pyz\Yves\WebProfilerWidget\WebProfilerWidgetDependencyProvider::getDataCollectorPlugins().
Starting from version 3.24.0 of spryker/zed-request, you can also access detailed Web Profiler views for Backend Gateway requests. For more information, see Integrate Web Profiler for Backend Gateway.
If you are using the key-value store (Redis or Valkey) as storage, you can track the calls to it as well. Starting from the redis version 2.4.0, the new data collector plugin \Spryker\Yves\Redis\Plugin\WebProfiler\WebProfilerRedisDataCollectorPlugin is available for that matter. To track calls to the key-value store (Redis or Valkey), add this plugin to \Pyz\Yves\WebProfilerWidget\WebProfilerWidgetDependencyProvider::getDataCollectorPlugins().
Same goes for Elasticsearch. Make sure your version of spryker/search-elasticsearch is 1.8.0 and add \Spryker\Yves\SearchElasticsearch\Plugin\WebProfiler\WebProfilerElasticsearchDataCollectorPlugin to \Pyz\Yves\WebProfilerWidget\WebProfilerWidgetDependencyProvider::getDataCollectorPlugins() to track calls to Elasticsearch.
Additional profiling with XHProf
If the xhprof extension is enabled and the Profiler module is integrated, the Web Profiler also includes detailed performance profiling data through XHProf. This provides function-level performance analysis and call graphs.
For information on integrating the Profiler module, see Integrate Profiler Module.
Web Profiler Widget for Yves AJAX
Starting from version 1.4.3 of the spryker-shop/web-profiler-widget module, the Web Profiler Widget supports collecting and displaying profiles for AJAX requests made from Yves.
When AJAX requests are executed on a Yves page, the Web Profiler Widget automatically captures their execution profiles. These profiles are then accessible directly within the Web Profiler toolbar at the bottom of the page.
Accessing Yves AJAX profiles
AJAX request profiles appear in the Web Profiler Widget toolbar, allowing you to inspect each request individually. The widget displays a list of all captured AJAX requests with their respective response times and status codes.

Viewing AJAX profile details
Clicking on a specific AJAX request in the widget opens the detailed profile view, showing comprehensive information about the request including:
- Request and response data
- Performance metrics
- ElasticSearch
- Redis
- Zed Requests
- External calls
- Profiler is
xhprofextension is installed
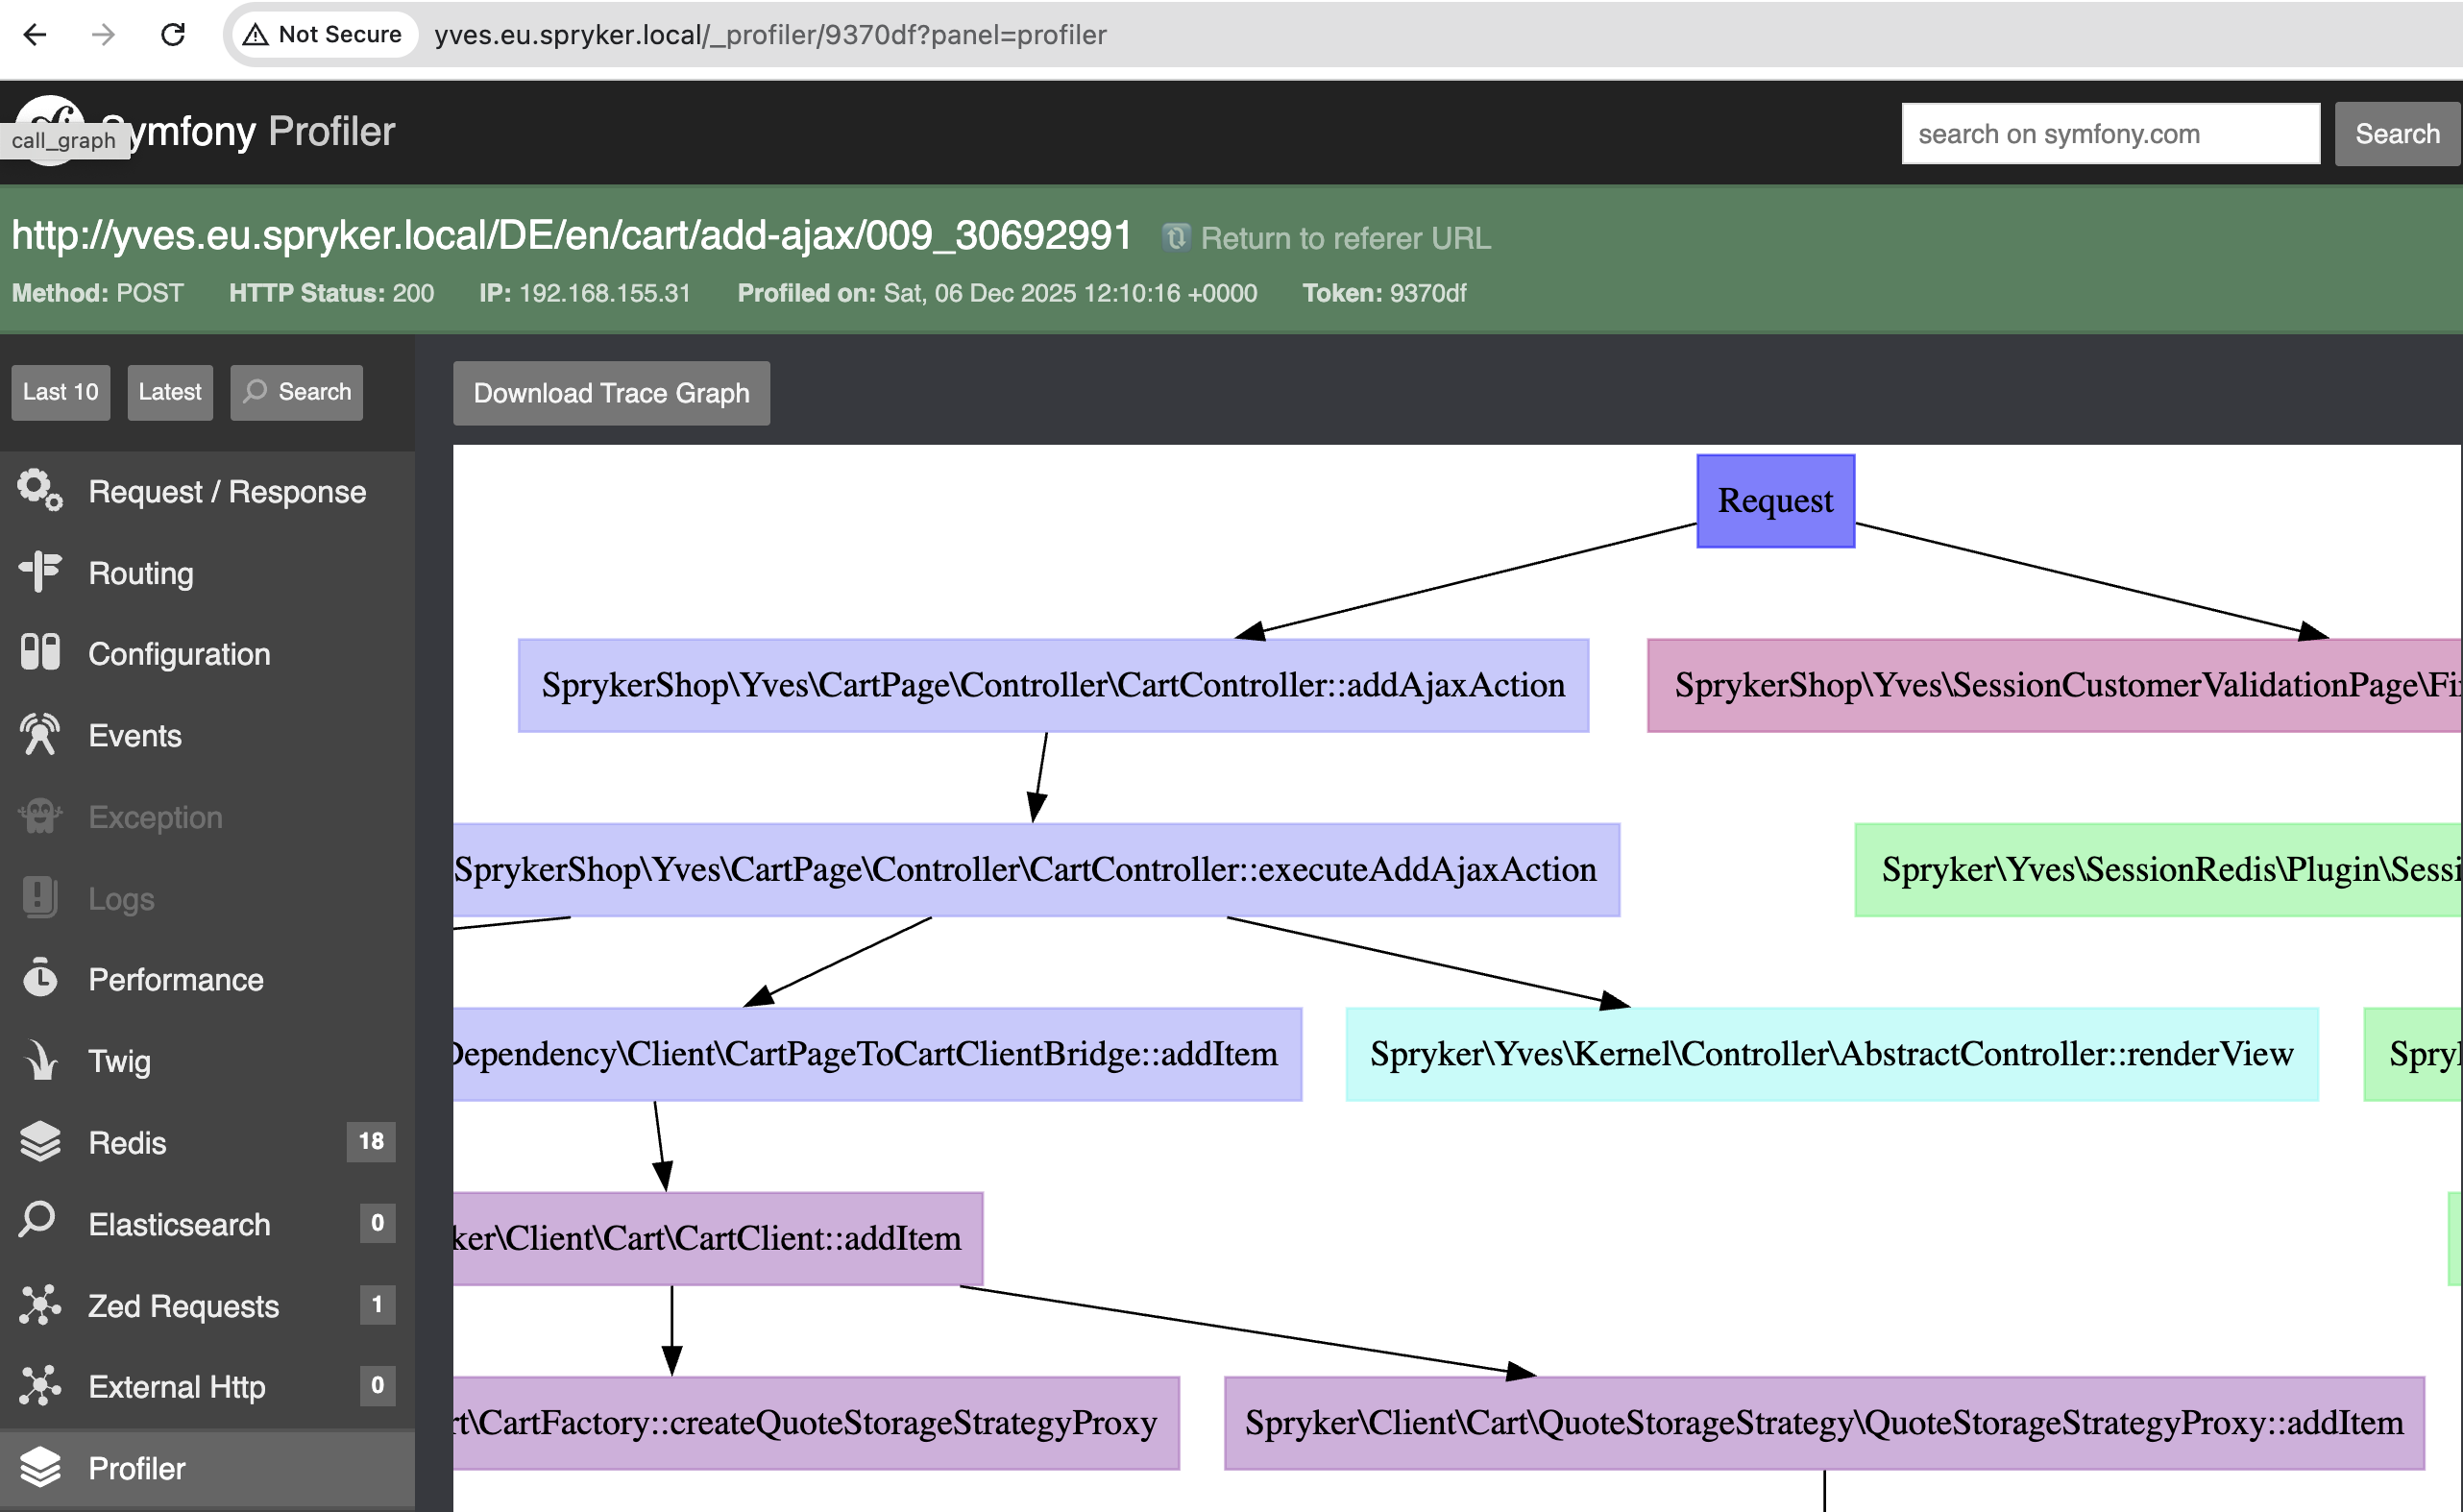
This feature enables developers to debug and optimize AJAX requests in the same way as regular page requests, providing full visibility into the execution flow of asynchronous operations.
Thank you!
For submitting the form