Tutorial — Troubleshooting an unavailable Zed
Edit on GitHubZed didn’t restart after a deployment or you can’t access it.
To troubleshoot this issue, you need to go through all the stages of information flow. The default information flow is: Front end > Gateway(optional) > Zed > ElastiCache, Elasticsearch, RMQ, and RDS.

1. Check logs
Check front-end, gateway, and Zed logs described below. Filter log groups by the following:
frontendbackgwbofficemportalbackapized
If you are troubleshooting response 504, besides errors, pay attention to warnings. Examples:
WARNING:[pool worker] child 18, script 'index.php' (request: "GET /index.php") execution timed out (61 sec),terminating
WARNING:[pool worker] child 18 exited on signal 15 (SIGTERM) after 221.30 seconds from start
Response 504 can be caused by the zed or boffice container reaching memory limit. If none of the steps in this document reveal the issue, make sure to include these warnings in your support ticket.
Check logs via Log groups:
-
In the AWS Management Console, go to Services > CloudWatch > Log groups.
-
In the Log groups pane, filter log groups by entering a query in the search bar. For example, enter staging.

-
Select the desired log group.
-
In the Log streams pane, select the log stream according the last event. The last event time should match the time when the issue occurred.

- In the Log events pane, filter events by entering a query in the search bar.
When browsing audit logs, you might want to filter by tile, like
audit, or by a user, like[email protected].
2. Check multiple log groups at once
Check front-end, gateway, and Zed logs described below. Select the log groups containing the following:
frontendbackgwbofficemportalbackapized
Check logs via Logs Insights:
- In the AWS Management Console, go to Services > CloudWatch.
- In the navigation pane, select Logs > Logs Insights.
- Select the desired log groups.

- Select the desired time period.
- Insert a search query into the query field. Use the following examples as a reference.
- Select Run query.
- Check the logs that appear in the pane below.
Example 1: search for 500 errors during the last 6 hours.

Example 2: search for build errors, excluding rds_backup, during the last 3 hours.

To learn more about the syntax of the queries, see CloudWatch Logs Insights query syntax. For more examples of queries, see Sample queries - Amazon CloudWatch Logs.
3. Check ECS services and tasks
Check the ECS services and tasks that are postfixed with the following:
- Front-end:
frontend - If gateway is deployed:
backgwbofficemportalbackapi
- Zed:
zed
To check the services and tasks, do the following:
- In the AWS Management Console, go to Services > Elastic Container Service.
- In the navigation pane, select Clusters.
- Select the cluster of the environment to which an unavailable service belongs.
- On the page of the cluster, select the unavailable service.
- On the page of the service, check if the Running count is equal to the Desired count. If the numbers are equal, the service is running correctly.
- Switch to the Tasks tab.
- Check if the Last status is Running.

- If the task is not running, switch to the Events tab and check the errors.

- Switch to the Tasks tab.
- For the Desired task status, select Stopped.
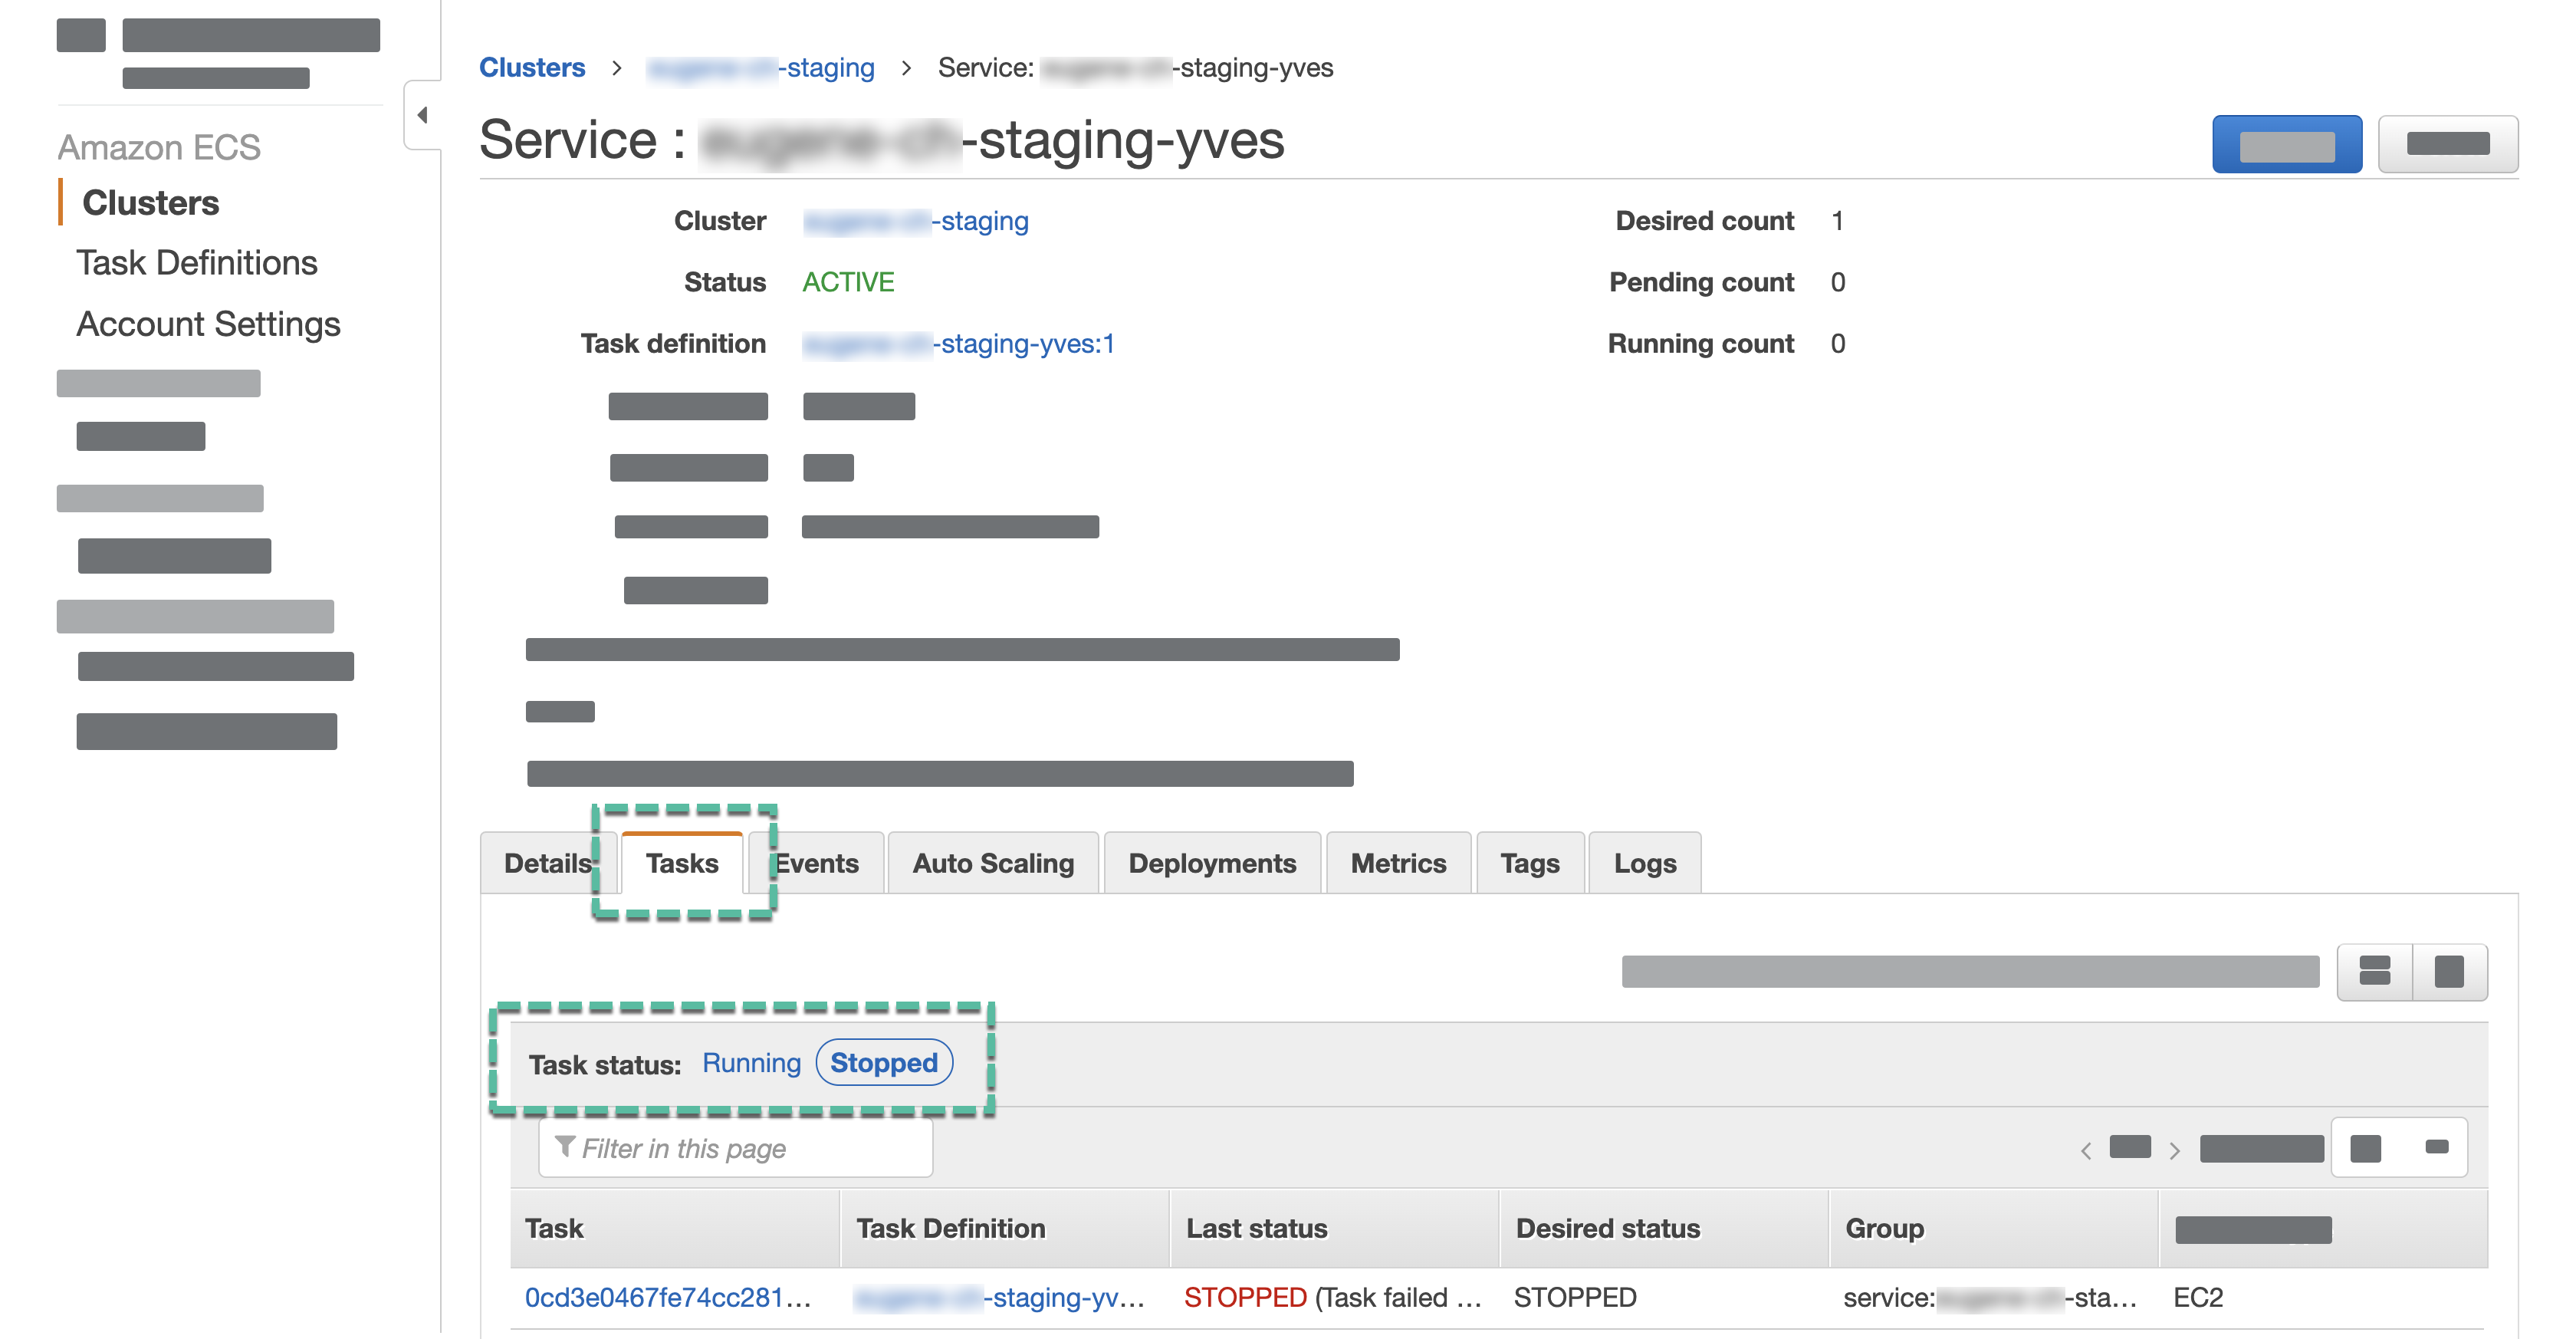
- Select the latest stopped task.
If there are multiple stopped tasks, to identify the latest one, open the page of every task and compare the Stopped at dates and times.
-
In the Containers section, select the arrow before the container name.
-
In the Details section, check the exit code and the errors.

4. Check key-value storage (Redis or Valkey) status
Check the status of key-value storage (Redis or Valkey) via AWS Management Console:
- In the AWS Management Console, go to Services > ElastiCache.
- In the navigation pane, select Redis or Valkey.
- Depending on the environment you are troubleshooting, check the Status of the respective cluster.
5. Check key-value storage (Redis or Valkey) system information
To check key-value storage (Redis or Valkey) system information via a CLI, do the following.
Check key-value storage connection details
Check SPRYKER_KEY_VALUE_STORE_PORT and SPRYKER_KEY_VALUE_STORE_HOST values as follows:
- In the AWS Management Console, go to Services > Elastic Container Service.
- In the navigation pane, select Task Definitions.
- Select the service you want to get the configuration for.
- Select the latest revision of the definition. For example, if the available definitions are
{ENVIRONMENT_NAME}-zed:1and{ENVIRONMENT_NAME}-zed:2, select{ENVIRONMENT_NAME}-zed:2. - On the page of the definition, switch to the JSON tab.
- Search by the desired service name. For example, to find the connection configuration of the broker, search by broker. You should be able to find the following information:
SPRYKER_BROKER_API_USERNAMESPRYKER_BROKER_API_PASSWORDSPRYKER_BROKER_API_HOSTSPRYKER_BROKER_API_PORT

Check key-value storage system information
-
Connect to the desired environment’s VPN.
-
Set the environment variables:
SPRYKER_KEY_VALUE_STORE_HOST={VALUE_FROM_THE_CONNECTION_CONFIGURATION} SPRYKER_KEY_VALUE_STORE_PORT={VALUE_FROM_THE_CONNECTION_CONFIGURATION}
- Get key-value storage system information using one of the following commands:
-
redis-cli -h ${SPRYKER_KEY_VALUE_STORE_HOST} -p ${SPRYKER_KEY_VALUE_STORE_PORT} INFO -
(printf "INFO\r\n";) | nc ${SPRYKER_KEY_VALUE_STORE_HOST} ${SPRYKER_KEY_VALUE_STORE_PORT}
Output example
# Server
redis_version:3.2.6
redis_git_sha1:0
redis_git_dirty:0
redis_build_id:0
redis_mode:standalone
os:Amazon ElastiCache
arch_bits:64
multiplexing_api:epoll
gcc_version:0.0.0
process_id:1
run_id:079573373ef2a82234b274b37f5bcf77964c8bf8
tcp_port:6379
uptime_in_seconds:8934977
uptime_in_days:103
hz:10
lru_clock:7343919
executable:-
config_file:-

# Clients
connected_clients:3
client_longest_output_list:0
client_biggest_input_buf:0
blocked_clients:0

# Memory
used_memory:25535552
used_memory_human:24.35M
used_memory_rss:31625216
used_memory_rss_human:30.16M
used_memory_peak:32192928
used_memory_peak_human:30.70M
used_memory_lua:44032
used_memory_lua_human:43.00K
maxmemory:2596012032
maxmemory_human:2.42G
maxmemory_policy:volatile-lru
mem_fragmentation_ratio:1.24
mem_allocator:jemalloc-4.0.3

# Persistence
loading:0
rdb_changes_since_last_save:85712
rdb_bgsave_in_progress:0
rdb_last_save_time:1634706053
rdb_last_bgsave_status:ok
rdb_last_bgsave_time_sec:0
rdb_current_bgsave_time_sec:-1
aof_enabled:0
aof_rewrite_in_progress:0
aof_rewrite_scheduled:0
aof_last_rewrite_time_sec:-1
aof_current_rewrite_time_sec:-1
aof_last_bgrewrite_status:ok
aof_last_write_status:ok

# Stats
total_connections_received:485535
total_commands_processed:25608497
instantaneous_ops_per_sec:6
total_net_input_bytes:6368580989
total_net_output_bytes:40921153915
instantaneous_input_kbps:0.14
instantaneous_output_kbps:7.03
rejected_connections:0
sync_full:0
sync_partial_ok:0
sync_partial_err:0
expired_keys:10310
evicted_keys:0
keyspace_hits:258867
keyspace_misses:329535
pubsub_channels:0
pubsub_patterns:0
latest_fork_usec:1374
migrate_cached_sockets:0

# Replication
role:master
connected_slaves:0
master_repl_offset:3318
repl_backlog_active:0
repl_backlog_size:1048576
repl_backlog_first_byte_offset:1740
repl_backlog_histlen:1579

# CPU
used_cpu_sys:4592.04
used_cpu_user:4582.52
used_cpu_sys_children:1.01
used_cpu_user_children:11.79

# Cluster
cluster_enabled:0

# Keyspace
db1:keys=25625,expires=15,avg_ttl=79925126
db2:keys=61,expires=61,avg_ttl=1804281
6. Check Elasticsearch status
Check Elasticsearch status via AWS Management Console:
-
In the AWS Management Console, go to Services > Amazon OpenSearch Service.
-
Select the desired environment.
-
On the page of the environment, check the following:
- Domain status: If the status is Active, Elasticsearch is running.
- Cluster health: If the status is Green or Yellow, Elasticsearch works properly.
-
Below the General information pane, switch to the Cluster health tab.
-
Select the desired Time range.
-
Check if any of the graphs are red.
-
Switch to the Instance health tab.
-
Select the desired Time range.
-
Check if any of the graphs are red.
7. Check Elasticsearch indices
To check Elasticsearch indices via a CLI, do the following.
Check Elasticsearch connection details
Check SPRYKER_SEARCH_HOST and SPRYKER_SEARCH_PORT values as follows:
- In the AWS Management Console, go to Services > Elastic Container Service.
- In the navigation pane, select Task Definitions.
- Select the service you want to get the configuration for.
- Select the latest revision of the definition. For example, if the available definitions are
{ENVIRONMENT_NAME}-zed:1and{ENVIRONMENT_NAME}-zed:2, select{ENVIRONMENT_NAME}-zed:2. - On the page of the definition, switch to the JSON tab.
- Search by the desired service name. For example, to find the connection configuration of the broker, search by broker. You should be able to find the following information:
SPRYKER_BROKER_API_USERNAMESPRYKER_BROKER_API_PASSWORDSPRYKER_BROKER_API_HOSTSPRYKER_BROKER_API_PORT
Check the health and status of Elasticsearch indices
-
Connect to the environment’s VPN.
-
Set the variables:
SPRYKER_SEARCH_HOST={VALUE_FROM_THE_CONNECTION_CONFIGURATION}
SPRYKER_SEARCH_PORT={VALUE_FROM_THE_CONNECTION_CONFIGURATION}
- Display the status of indices:
curl -s "$SPRYKER_SEARCH_HOST:$SPRYKER_SEARCH_PORT/_cat/indices/*?v=true&s=index"
- In the output, check the following:
healthisgreenoryellow.statusisopen.

8. Check the database
Check the status of the RDS database:
-
In the AWS management console, go to Services > RDS.
-
In the navigation pane, select Databases.
-
In the Databases pane, select the database of the desired environment.
This opens the page of the database. To check for issues, do the following:
- In the Summary pane, check the Status. If the status is Available, the database is running.
- Switch to the Monitoring tab and, In the CloudWatch pane, check if there are any spikes on the graphs. Consider ten times more of a usual usage a spike. For example, if the usual CPU Utilization is 4%, consider any usage above 40% a spike.

Thank you!
For submitting the form